
Rationale and Objectives
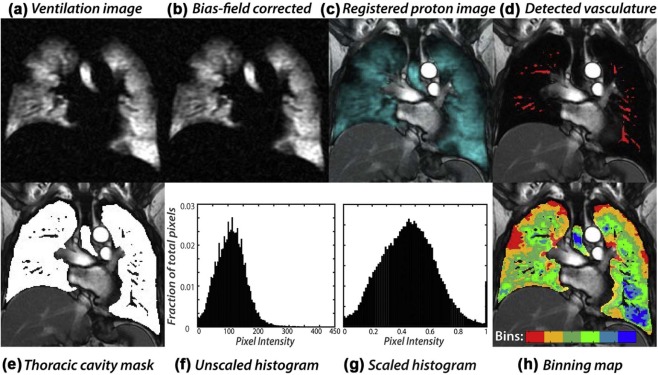
Ventilation heterogeneity is impossible to detect with spirometry. Alternatively, pulmonary ventilation can be imaged three-dimensionally using inhaled 129 Xe magnetic resonance imaging (MRI). To date, such images have been quantified primarily based on ventilation defects. Here, we introduce a robust means to transform 129 Xe MRI scans such that the underlying ventilation distribution and its heterogeneity can be quantified.
Materials and Methods
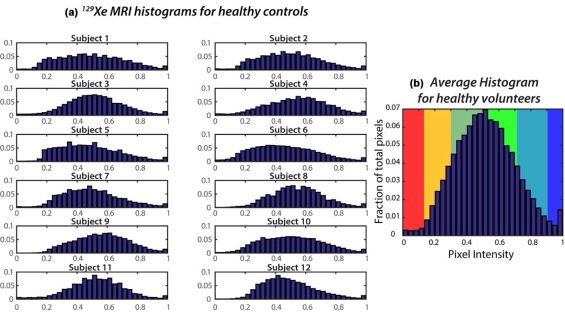
Quantitative 129 Xe ventilation MRI was conducted in 12 younger (24.7 ± 5.2 years) and 10 older (62.2 ± 7.2 years) healthy individuals, as well as in 9 younger (25.9 ± 6.4 yrs) and 10 older (63.2 ± 6.1 years) asthmatics. The younger healthy population was used to establish a reference ventilation distribution and thresholds for six intensity bins. These bins were used to display and quantify the ventilation defect region (VDR), the low ventilation region (LVR), and the high ventilation region (HVR).
Results
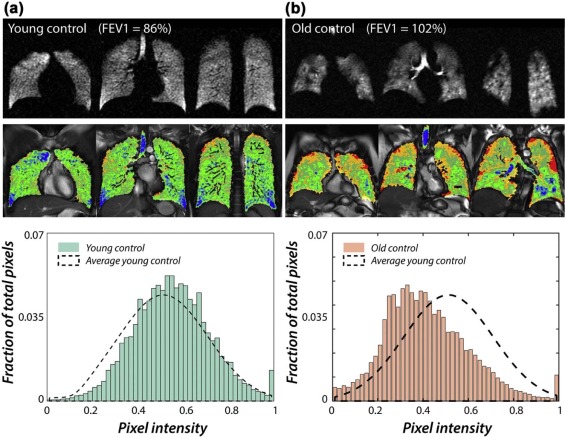
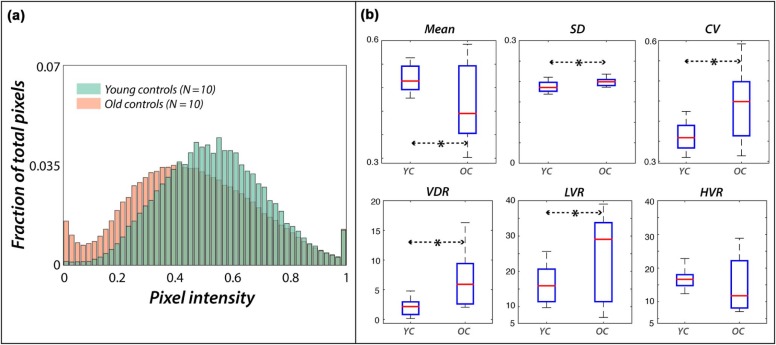
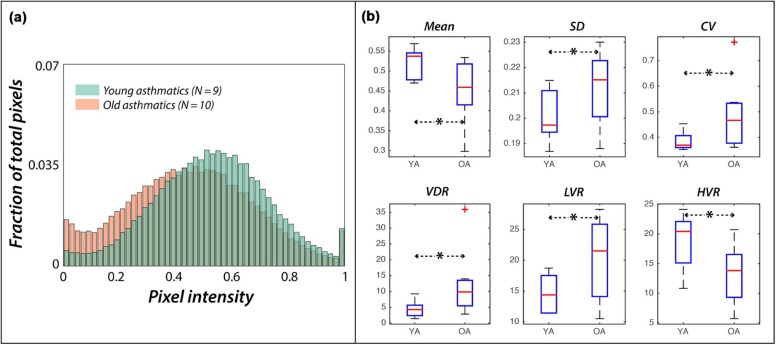
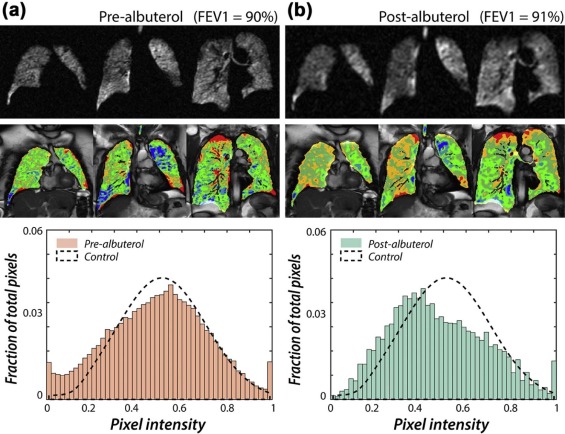
The ventilation distribution in young subjects was roughly Gaussian with a mean and standard deviation of 0.52 ± 0.18, resulting in VDR = 2.1 ± 1.3%, LVR = 15.6 ± 5.4%, and HVR = 17.4 ± 3.1%. Older healthy volunteers exhibited a significantly right-skewed distribution (0.46 ± 0.20, P = 0.034), resulting in significantly increased VDR (7.0 ± 4.8%, P = 0.008) and LVR (24.5 ± 11.5%, P = 0.025). In the asthmatics, VDR and LVR increased in the older population, and HVR was significantly reduced (13.5 ± 4.6% vs 18.9 ± 4.5%, P = 0.009). Quantitative 129 Xe MRI also revealed altered ventilation heterogeneity in response to albuterol in two asthmatics with normal spirometry.
Conclusions
Quantitative 129 Xe MRI provides a robust and objective means to display and quantify the pulmonary ventilation distribution, even in subjects who have airway function impairment not appreciated by spirometry.
Introduction
The distribution of ventilation is known to be nonuniform in healthy lungs , and this heterogeneity increases with age and disease. Ventilation heterogeneity is impossible to quantify using spirometry because it measures the lung as a single unit and is insensitive to pathology in the small airways—the so-called silent zone. Alternative approaches include using the multiple-breath nitrogen washout (MBNW) test to determine the distribution of specific ventilation (SV) , the lung clearance index (LCI) , or the multiple inert gas elimination technique (MIGET) to quantify the ventilation–perfusion relationship ; however, none of these tests provides spatial information. Alternatively, imaging methods such as computed tomography (CT) delineate spatial changes in lung structures that may allow ventilation abnormalities to be inferred. However, CT does not directly measure ventilation and its radiation dose limits some longitudinal studies.
Recently, magnetic resonance imaging (MRI) techniques have emerged that enable direct detection of inhaled gases, such as oxygen , perfluorinated gases , and hyperpolarized (HP) 3 He . These techniques enable visualization of ventilation defects that have been shown to correlate with airway tone and airway abnormalities . HP 3 He MRI readily depicts regional ventilation heterogeneity in patients with pulmonary obstructive diseases . More recently, 129 Xe gas has emerged as the most promising alternative to address dwindling supplies of 3 He . 129 Xe MRI appears to more readily detect ventilation defects than 3 He MRI and has been used to visualize elimination of ventilation defects after bronchodilator administration .
Get Radiology Tree app to read full this article<
Get Radiology Tree app to read full this article<
Methods
Subjects
Get Radiology Tree app to read full this article<
Image Acquisition
Get Radiology Tree app to read full this article<
Image Analysis
Get Radiology Tree app to read full this article<
Get Radiology Tree app to read full this article<
Get Radiology Tree app to read full this article<
Statistical Methods
Get Radiology Tree app to read full this article<
Results
Study Population
Get Radiology Tree app to read full this article<
Distribution of Ventilation in Young Healthy Subjects
Get Radiology Tree app to read full this article<
Get Radiology Tree app to read full this article<
Effects of Age
Get Radiology Tree app to read full this article<
Get Radiology Tree app to read full this article<
Get Radiology Tree app to read full this article<
Get Radiology Tree app to read full this article<
Ventilation Distribution in Older and Younger Asthmatics
Get Radiology Tree app to read full this article<
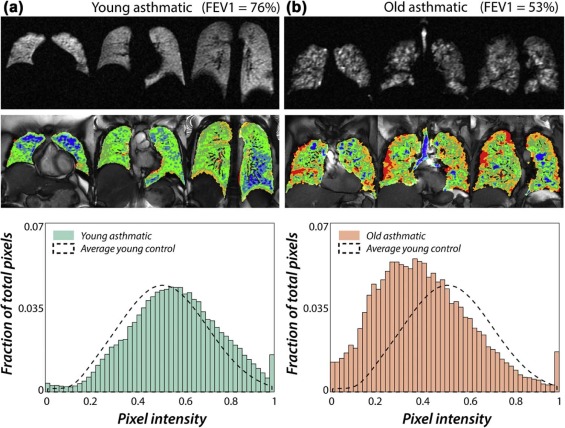
Get Radiology Tree app to read full this article<
Get Radiology Tree app to read full this article<
Get Radiology Tree app to read full this article<
Differences between FEV1 and 129 Xe MRI Ventilation Distribution
Get Radiology Tree app to read full this article<
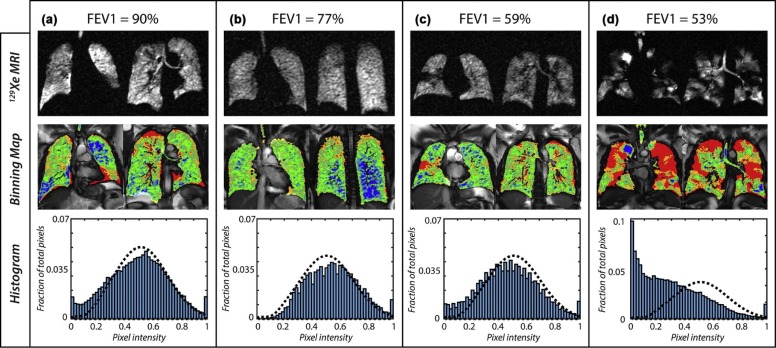
Get Radiology Tree app to read full this article<
Ventilation Distribution Before and After Albuterol Treatment
Get Radiology Tree app to read full this article<
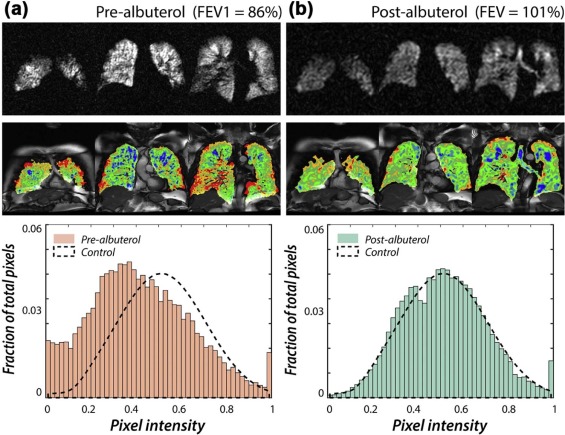
Get Radiology Tree app to read full this article<
Discussion
Get Radiology Tree app to read full this article<
Get Radiology Tree app to read full this article<
Get Radiology Tree app to read full this article<
Get Radiology Tree app to read full this article<
Get Radiology Tree app to read full this article<
Get Radiology Tree app to read full this article<
Get Radiology Tree app to read full this article<
Get Radiology Tree app to read full this article<
Get Radiology Tree app to read full this article<
Get Radiology Tree app to read full this article<
References
1. Wagner P.D., Laravuso R.B., Uhl R.R., et. al.: Continuous distributions of ventilation-perfusion ratios in normal subjects breathing air and 100 per cent O 2 . J Clin Invest 1974; 54: pp. 54-68.
2. Lewis S.M., Evans J.W., Jalowayski A.A.: Continuous distributions of specific ventilation recovered from inert gas washout. J Appl Physiol Respir Environ Exerc Physiol 1978; 44: pp. 416-423.
3. Simon B.A., Kaczka D.W., Bankier A.A., et. al.: What can computed tomography and magnetic resonance imaging tell us about ventilation?. J Appl Physiol 2012; 113: pp. 647-657.
4. Tzeng Y.S., Lutchen K., Albert M.: The difference in ventilation heterogeneity between asthmatic and healthy subjects quantified using hyperpolarized 3He MRI. J Appl Physiol 2009; 106: pp. 813-822.
5. Verbanck S., Thompson B.R., Schuermans D., et. al.: Ventilation heterogeneity in the acinar and conductive zones of the normal ageing lung. Thorax 2012; 67: pp. 789-795.
6. Wagner P.D., Saltzman H.A., West J.B.: Measurement of continuous distributions of ventilation-perfusion ratios: theory. J Appl Physiol 1974; 36: pp. 588-599.
7. Robinson P.D., Latzin P., Verbanck S., et. al.: Consensus statement for inert gas washout measurement using multiple- and single- breath tests. Eur Respir J 2013; 41: pp. 507-522.
8. Horsley A., Wild J.M.: Ventilation heterogeneity and the benefits and challenges of multiple breath washout testing in patients with cystic fibrosis. Paediatr Respir Rev 2015; 16: pp. 15-18.
9. Kent L., Reix P., Innes J.A., et. al.: Lung clearance index: evidence for use in clinical trials in cystic fibrosis. J Cyst Fibros 2014; 13: pp. 123-138.
10. Horsley A.: Lung clearance index in the assessment of airways disease. Resp Med 2009; 103: pp. 793-799.
11. Aurora P., Gustafsson P., Bush A., et. al.: Multiple breath inert gas washout as a measure of ventilation distribution in children with cystic fibrosis. Thorax 2004; 59: pp. 1068-1073.
12. Edelman R.R., Hatabu H., Tadamura E., et. al.: Noninvasive assessment of regional ventilation in the human lung using oxygen-enhanced magnetic resonance imaging. Nat Med 1996; 2: pp. 1236-1239.
13. Ohno Y., Hatabu H., Takenaka D., et. al.: Dynamic oxygen-enhanced MRI reflects diffusing capacity of the lung. Magn Reson Med 2002; 47: pp. 1139-1144.
14. Sa R.C., Asadi A.K., Theilmann R.J., et. al.: Validating the distribution of specific ventilation in healthy humans measured using proton MR imaging. J Appl Physiol 2014; 116: pp. 1048-1056.
15. Halaweish A.F., Moon R.E., Foster W.M., et. al.: Perfluoropropane gas as a magnetic resonance lung imaging contrast agent in humans. Chest 2013; 144: pp. 1300-1310.
16. Ouriadov A.V., Fox M.S., Couch M.J., et. al.: In vivo regional ventilation mapping using fluorinated gas MRI with an x-centric FGRE method. Magn Reson Med 2015; 74: pp. 550-557.
17. Salerno M., Altes T.A., Mugler J.P., et. al.: Hyperpolarized noble gas MR imaging of the lung: potential clinical applications. Eur J Radiol 2001; 40: pp. 33-44.
18. de Lange E.E., Altes T.A., Patrie J.T., et. al.: Evaluation of asthma with hyperpolarized helium-3 MRI: correlation with clinical severity and spirometry. Chest 2006; 130: pp. 1055-1062.
19. Costella S., Kirby M., Maksym G.N., et. al.: Regional pulmonary response to a methacholine challenge using hyperpolarized 3He magnetic resonance imaging. Respirology 2012; 17: pp. 1237-1246.
20. Kirby M., Svenningsen S., Owrangi A., et. al.: Hyperpolarized 3He and 129Xe MR imaging in healthy volunteers and patients with chronic obstructive pulmonary disease. Radiology 2012; 265: pp. 600-610.
21. Svenningsen S., Kirby M., Starr D., et. al.: What are ventilation defects in asthma?. Thorax 2014; 69: pp. 63-71.
22. Fain S.B., Gonzalez-Fernandez G., Peterson E.T., et. al.: Evaluation of structure-function relationships in asthma using multidetector CT and hyperpolarized He-3 MRI. Acad Radiol 2008; 15: pp. 753-762.
23. Altes T.A., Powers P.L., Knight-Scott J., et. al.: Hyperpolarized 3He MR lung ventilation imaging in asthmatics: preliminary findings. J Magn Reson Imaging 2001; 13: pp. 378-384.
24. Mugler J.P., Altes T.A.: Hyperpolarized 129Xe MRI of the human lung. J Magn Reson Imaging 2013; 37: pp. 313-331.
25. Virgincar R.S., Cleveland Z.I., Kaushik S.S., et. al.: Quantitative analysis of hyperpolarized 129Xe ventilation imaging in healthy volunteers and subjects with chronic obstructive pulmonary disease. NMR Biomed 2013; 26: pp. 424-435.
26. Stewart N.J., Norquay G., Griffiths P.D., et. al.: Feasibility of human lung ventilation imaging using highly polarized naturally abundant xenon and optimized three-dimensional steady-state free precession. Magn Reson Med 2015; 74: pp. 346-352.
27. Kirby M., Svenningsen S., Kanhere N., et. al.: Pulmonary ventilation visualized using hyperpolarized helium-3 and xenon-129 magnetic resonance imaging: differences in COPD and relationship to emphysema. J Appl Physiol 2013; 114: pp. 707-715.
28. Svenningsen S., Kirby M., Starr D., et. al.: Hyperpolarized 3He and 129Xe MRI: differences in asthma before bronchodilation. J Magn Reson Imaging 2013; 38: pp. 1521-1530.
29. Woodhouse N., Wild J.M., Paley M.N., et. al.: Combined helium-3/proton magnetic resonance imaging measurement of ventilated lung volumes insmokers compared to never-smokers. J Magn Reson Imaging 2005; 21: pp. 365-369.
30. Kirby M., Heydarian M., Svenningsen S., et. al.: Hyperpolarized 3He magnetic resonance functional imaging semiautomated segmentation. Acad Radiol 2012; 19: pp. 141-152.
31. He M., Kaushik S.S., Robertson S.H., et. al.: Extending semiautomatic ventilation defect analysis for hyperpolarized (129)Xe ventilation MRI. Acad Radiol 2014; 21: pp. 1530-1541.
32. Hahn A.D., Cadman R.V., Sorkness R.L., et. al.: Redistribution of inhaled hyperpolarized He3 gas during breath-hold differs by asthma severity. J Appl Physiol 2016; 120: pp. 526-536. jap 00197 2015
33. Ebner L., He M., Virgincar R.S., et. al.: Hyperpolarized 129Xenon MRI to quantify regional ventilation differences in mild to moderate asthma: a prospective comparison between semi-automated ventilation defect percentage calculation and pulmonary function tests. Invest Radiol 2016; In Press
34. He M., Robertson S.H., Kaushik S.S., et. al.: Dose and pulse sequence considerations for hyperpolarized (129)Xe ventilation MRI. Magn Reson Imaging 2015; 33: pp. 877-885.
35. Fulambarker A., Copur A.S., Javet A., et. al.: Reference values for pulmonary function in Asian Indians living in the United States. Chest 2004; 126: pp. 1225-1233.
36. Kirby M., Mathew L., Wheatley A., et. al.: Chronic obstructive pulmonary disease: longitudinal hyperpolarized 3He MR imaging. Radiology 2010; 256: pp. 280-289.
37. Hamerly G., Elkan C.: Learning the K in K-means. NIPS 2003; 17:
38. MacKay D.J.C.: Information theory, inference, and learning algorithms.2004.Cambridge University PressCambridge, UK, New York Reprinted with corrections. ed
39. Deninger A.J., Mansson S., Petersson J.S., et. al.: Quantitative measurement of regional lung ventilation using He-3 MRI. Magn Reson Med 2002; 48: pp. 223-232.
40. Emami K., Kadlecek S.J., Woodburn J.M., et. al.: Improved technique for measurement of regional fractional ventilation by hyperpolarized 3He MRI. Magn Reson Med 2010; 63: pp. 137-150.
41. Horn F.C., Deppe M.H., Marshall H., et. al.: Quantification of regional fractional ventilation in human subjects by measurement of hyperpolarized 3He washout with 2D and 3D MRI. J Appl Physiol 2014; 116: pp. 129-139.
42. Hamedani H., Clapp J.T., Kadlecek S.J., et. al.: Regional fractional ventilation by using multibreath wash-in 3He MR imaging. Radiology 2016; 279: pp. 917-924. 150495
43. Sa R.C., Cronin M.V., Henderson A.C., et. al.: Vertical distribution of specific ventilation in normal supine humans measured by oxygen-enhanced proton MRI. J Appl Physiol 2010; 109: pp. 1950-1959.
44. Sheikh K., Paulin G.A., Svenningsen S., et. al.: Pulmonary ventilation defects in older never-smokers. J Appl Physiol 2014; 117: pp. 297-306.
45. Janssens J.P., Pache J.C., Nicod L.P.: Physiological changes in respiratory function associated with ageing. Eur Respir J 1999; 13: pp. 197-205.
46. Cardus J., Burgos F., Diaz O., et. al.: Increase in pulmonary ventilation-perfusion inequality with age in healthy individuals. Am J Respir Crit Care Med 1997; 156: pp. 648-653.
47. Heckscher T., Bass H., Oriol A., et. al.: Regional lung function in patients with bronchial asthma. J Clin Invest 1968; 47: pp. 1063-1070.
48. Gompelmann D., Eberhardt R., Herth F.J.: Collateral ventilation. Respiration 2013; 85: pp. 515-520.
49. Macklem P.T.: Airway obstruction and collateral ventilation. Physiol Rev 1971; 51: pp. 368-436.
50. Kaminsky D.A., Bates J.H., Irvin C.G.: Effects of cool, dry air stimulation on peripheral lung mechanics in asthma. Am J Respir Crit Care Med 2000; 162: pp. 179-186.
51. Moore W.C., Meyers D.A., Wenzel S.E., et. al.: Identification of asthma phenotypes using cluster analysis in the severe asthma research program. Am J Respir Crit Care Med 2010; 181: pp. 315-323.
52. Despas P.J., Leroux M., Macklem P.T.: Site of airway obstruction in asthma as determined by measuring maximal expiratory flow breathing air and a helium-oxygen mixture. J Clin Invest 1972; 51: pp. 3235-3243.
53. Lagerstrand L., Skedinger M., Ihre E., et. al.: Spirometry and ventilation-perfusion inequality in patients with mild allergic asthma before and during the pollen season. Clin Physiol 1995; 15: pp. 355-364.
54. Cardus J., Burgos F., Diaz O., et. al.: Increase in pulmonary ventilation-perfusion inequality with age in healthy individuals. Am J Respir Crit Care Med 1997; 156: pp. 648-653.
55. Macleod K.A., Horsley A.R., Bell N.J., et. al.: Ventilation heterogeneity in children with well controlled asthma with normal spirometry indicates residual airways disease. Thorax 2009; 64: pp. 33-37.
56. Kraemer R., Blum A., Schibler A., et. al.: Ventilation inhomogeneities in relation to standard lung function in patients with cystic fibrosis. Am J Resp Crit Care 2005; 171: pp. 371-378.