
Objectives
The objective of this study was to find clinical parameters and qualitative and quantitative magnetic resonance imaging (MRI) features for differentiating uterine sarcoma from atypical leiomyoma (ALM) preoperatively and to calculate predictive values for uterine sarcoma.
Materials and Methods
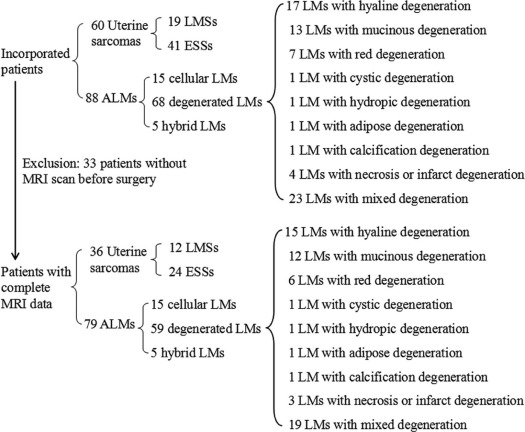
Data from 60 patients with uterine sarcoma and 88 patients with ALM confirmed by surgery and pathology were collected. Clinical parameters, qualitative MRI features, diffusion-weighted imaging with apparent diffusion coefficient values, and quantitative parameters of dynamic contrast-enhanced MRI of these two tumor types were compared. Predictive values for uterine sarcoma were calculated using multivariable logistic regression.
Results
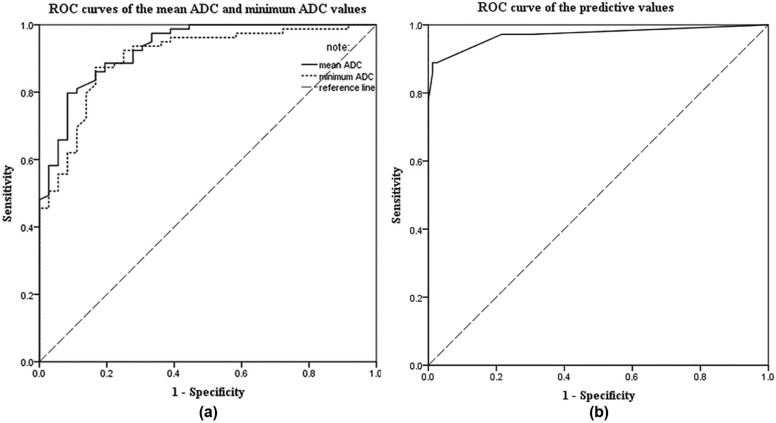
Patient clinical manifestations, tumor locations, margins, T2-weighted imaging signals, mean apparent diffusion coefficient values, minimum apparent diffusion coefficient values, and time-signal intensity curves of solid tumor components were obvious significant parameters for distinguishing between uterine sarcoma and ALM (all P < .001). Abnormal vaginal bleeding, tumors located mainly in the uterine cavity, ill-defined tumor margins, and mean apparent diffusion coefficient values of <1.272 × 10 −3 mm 2 /s were significant preoperative predictors of uterine sarcoma. When the overall scores of these four predictors were greater than or equal to 7 points, the sensitivity, the specificity, the accuracy, and the positive and negative predictive values were 88.9%, 99.9%, 95.7%, 97.0%, and 95.1%, respectively.
Conclusions
The use of clinical parameters and multiparametric MRI as predictive factors was beneficial for diagnosing uterine sarcoma preoperatively. These findings could be helpful for guiding treatment decisions.
Introduction
Uterine sarcoma is a rare tumor characterized by high malignancy and very poor prognosis . The most common entities are leiomyosarcoma (LMS), endometrial stromal sarcoma (ESS), and carcinosarcoma . However, according to the Federation of Gynecology and Obstetrics (FIGO) staging system revised in 2009, carcinosarcoma is regarded as a subset of endometrial carcinoma because of the similarity in biological behavior . The standard surgical excision of uterine sarcoma consists of hysterectomy and bilateral salpingo-oophorectomy . Uterine leiomyoma (LM) is the most common benign smooth muscle tumor of the uterus and can be treated with nonsurgical options, such as drugs , high-intensity focused ultrasound , and artery embolization . Uterine sarcoma is often misdiagnosed as LM because of their similar clinical presentations ; thus, it is very important to distinguish them to avoid delaying hysterectomy in women with presumed symptomatic fibroids who, in fact, have a uterine sarcoma.
Previous studies have reported that uterine sarcoma differed from benign uterine tumors in patient age, serum lactate dehydrogenase (LDH) levels, and endometrial cytology findings , whereas there are many overlaps between uterine sarcoma and LM in age and LDH levels, and endometrial cytology is negative when the tumor is located in the myometrium only. Therefore, it is difficult to differentiate uterine sarcoma from LM by relying only on clinical parameters. Imaging examinations are necessary to identify them precisely.
Get Radiology Tree app to read full this article<
Get Radiology Tree app to read full this article<
Materials and Methods
Study Subjects
Get Radiology Tree app to read full this article<
Clinical Parameters
Get Radiology Tree app to read full this article<
MRI Protocol
Get Radiology Tree app to read full this article<
Table 1
Details of Imaging Protocols for All Magnetic Resonance Imaging Sequences
Parameters T2WI T1WI DWI Contrast-enhanced T1WI Axial Sagittal Axial Axial Axial Sagittal TR (ms) 4400 3040 175 4375 4 3.9 TE (ms) 106.6 107.5 1.8 65.6 1.9 1.8 FOV (cm) 28 × 22.4 28 × 22.4 40 × 28 36 × 27 40 × 32 35 × 28 Matrix 288 × 224 320 × 224 320 × 224 128 × 128 320 × 224 288 × 224 Slice thickness (mm) 5 6 5 5 4 4 Slice gap (mm) 1.5 1 1 1.5 0 0 NEX 1 1 1 5 0.72 0.71
DWI, diffusion-weighted imaging; FOV, field of view; NEX, number of excitation; TE, echo time; TR, repetition time; T1WI, T1-weighted imaging; T2WI, T2-weighted imaging.
Get Radiology Tree app to read full this article<
MRI Analysis
Get Radiology Tree app to read full this article<
Statistical Analyses
Get Radiology Tree app to read full this article<
Results
Pathologic Diagnoses
Get Radiology Tree app to read full this article<
Get Radiology Tree app to read full this article<
Get Radiology Tree app to read full this article<
Clinical Parameters
Get Radiology Tree app to read full this article<
Table 2
Univariate Analysis of Clinical Parameters for the Uterine Sarcoma and Atypical Leiomyoma Groups
Uterine Sarcoma ( n = 60) Atypical Leiomyoma ( n = 88)P Age (y), range 46 ± 12, 20–76 42 ± 9, 21–77 .019 BMI (kg/m 2 ) 20.93 ± 3.84 22.71 ± 2.89 .961 Childbearing history Nulliparity 7 15 .366 Abortion 45 74 .171 Clinical manifestation Abnormal vaginal bleeding 23 4<.001 Menstrual changes \* 19 22 .374 Abdominal pain 9 11 .662 Pelvic mass 5 9 .699 Urinary symptoms 2 3 1.000 Physical examinations 2 39 <.001 CA125 ↑ (>35 U/mL) † 14 14 .128 LDH ↑ (>245 U/L) ‡ 8 4 .020 Serum albumin ↓ (<40 g/L) § 30 31 .064 FIGO stage Stage I 54 — — Stage II 6 — —
BMI, body mass index; CA125, cancer antigen 125; FIGO, Federation of Gynecology and Obstetrics; LDH, lactate dehydrogenase.
Continuous variables were expressed as arithmetic means and standard deviations, and categorical variables were described with frequencies.
P , comparing data between uterine sarcoma and atypical leiomyoma by the Student t test, the Mann-Whitney U test, the Pearson χ 2 test, or the Fisher exact test.
Boldfaced value indicates obvious significant difference parameters in which the frequency of uterine sarcoma was greater than that of atypical leiomyoma with a value of P < .001.
Get Radiology Tree app to read full this article<
Get Radiology Tree app to read full this article<
Get Radiology Tree app to read full this article<
Get Radiology Tree app to read full this article<
Get Radiology Tree app to read full this article<
MRI Parameters
Get Radiology Tree app to read full this article<
Table 3
Univariate Analysis of MRI Parameters for the Uterine Sarcoma and Atypical Leiomyoma Groups
Uterine Sarcoma
( n = 36) Atypical Leiomyoma
( n = 79)P Main location Myometrium 8 44 .001 Uterine cavity 17 4<.001 Subserosa 2 23 .004 Cervical canal 3 1 .090 Extrauterine 6 7 .220 Shape Massive 26 51 .418 Round 4 24 .034 Nodular 0 3 .551 Polypoid 3 0 .029 Irregular shape 3 1 .090 Maximum tumor diameters (mm) 67.2 ± 30.3 83.3 ± 49.4 .156 Ill-defined margin on T2WI 29 3<.001 Solid components on T2WI Slight hyperintensity 16 20 .040 Isointensity 0 10 .030 Slight hypointensity 1 31 <.001 Mixed signal 19 18 .001 Mean ADC 1.015 ± 0.192 1.441 ± 0.270<.001 Minimum ADC 0.806 ± 0.167 1.167 ± 0.261<.001 TIC I 10 17 .532 II 7 47 <.001 III 19 15<.001 MCER 2.62 ± 1.61 2.00 ± 0.77 .008 EER 1.65 ± 1.48 0.93 ± 0.99 .005
ADC, apparent diffusion coefficient; EER, early enhancement ratio; MCER, maximum contrast enhancement ratio; T2WI, T2-weighted imaging; TIC, time signal-intensity curves.
Continuous variables were expressed as arithmetic means and standard deviations, and categorical variables were described with frequencies.
P , comparing data between uterine sarcoma and atypical leiomyoma by the Student t test, the Mann-Whitney U test, the Pearson χ 2 test, or the Fisher exact test.
Boldfaced values indicate obvious significant difference parameters in which the frequency of uterine sarcoma was greater than that of atypical leiomyoma with a value of P < .001.
Get Radiology Tree app to read full this article<
Get Radiology Tree app to read full this article<
Predictors and Predictive Values
Get Radiology Tree app to read full this article<
Table 4
Predictive Values of Each Predictive Factor
Odds Ratio_P_ Parameter Estimates Predictive Values (Points) Abnormal vaginal bleeding 13.054 .000 2.569 3 Located in the uterine cavity 26.159 .040 3.264 3 Ill-defined margin on T2WI 81.206 .000 4.397 4 Mean ADC < 1.272 × 10 −3 mm 2 /s 99.371 .001 4.599 5 Type III of the TICs of the lesions 1.149 .888 0.139 —
ADC, apparent diffusion coefficient; T2WI, T2-weighted imaging; TIC, time signal-intensity curves.
P , obtaining predictive factors by multivariable logistic regression analysis with a value of P < .05.
Get Radiology Tree app to read full this article<
Discussion
Get Radiology Tree app to read full this article<
Get Radiology Tree app to read full this article<
Get Radiology Tree app to read full this article<
Get Radiology Tree app to read full this article<
Get Radiology Tree app to read full this article<
Get Radiology Tree app to read full this article<
Get Radiology Tree app to read full this article<
Get Radiology Tree app to read full this article<
Get Radiology Tree app to read full this article<
References
1. Piura B., Rabinovich A., Yanai-Inbar I., et. al.: Uterine sarcoma in the south of Israel: study of 36 cases. J Surg Oncol 1997; 64: pp. 55-62.
2. Gadducci A., Cosio S., Romanini A., et. al.: The management of patients with uterine sarcoma: a debated clinical challenge. Crit Rev Oncol Hematol 2008; 65: pp. 129-142.
3. Tirumani S.H., Ojili V., Shanbhogue A.K., et. al.: Current concepts in the imaging of uterine sarcoma. Abdom Imaging 2013; 38: pp. 397-411.
4. Prat J.: FIGO staging for uterine sarcomas. Int J Gynaecol Obstet 2009; 104: pp. 177-178.
5. Khan A.T., Shehmar M., Gupta J.K.: Uterine fibroids: current perspectives. Int J Womens Health 2014; 6: pp. 95-114.
6. Yang S., Kong F., Hou R., et. al.: Ultrasound guided high-intensity focused ultrasound combined with gonadotropin releasing hormone analogue (GnRHa) ablating uterine leiomyoma with homogeneous hyperintensity on T2 weighted MR imaging. Br J Radiol 2017; 90: pp. 20160760.
7. Brito Pires N.M., Godoi E.T., Oliveira D.C., et. al.: Impact of pelvic magnetic resonance imaging findings in the indication of uterine artery embolization in the treatment of myoma. Ginekol Pol 2017; 88: pp. 129-133.
8. Zhang J., Li T., Zhang J., et. al.: Clinical characteristics and prognosis of unexpected uterine sarcoma after hysterectomy for presumed myoma with and without transvaginal scalpel morcellation. Int J Gynecol Cancer 2016; 26: pp. 456-463.
9. Nagai T., Takai Y., Akahori T., et. al.: Novel uterine sarcoma preoperative diagnosis score predicts the need for surgery in patients presenting with a uterine mass. Springerplus 2014; 3: pp. 678.
10. Nagai T., Takai Y., Akahori T., et. al.: Highly improved accuracy of the revised PREoperative sarcoma score (rPRESS) in the decision of performing surgery for patients presenting with a uterine mass. Springerplus 2015; 4: pp. 520.
11. Hricak H., Tscholakoff D., Heinrichs L., et. al.: Uterine leiomyomas: correlation of MR, histopathologic findings, and symptoms. Radiology 1986; 158: pp. 385-391.
12. Santos P., Cunha T.M.: Uterine sarcomas: clinical presentation and MRI features. Diagn Interv Radiol 2015; 21: pp. 4-9.
13. Gaetke-Udager K., McLean K., Sciallis A.P., et. al.: Diagnostic accuracy of ultrasound, contrast-enhanced CT, and conventional MRI for differentiating leiomyoma from leiomyosarcoma. Acad Radiol 2016; 23: pp. 1290-1297.
14. Bonneau C., Thomassin-Naggara I., Dechoux S., et. al.: Value of ultrasonography and magnetic resonance imaging for the characterization of uterine mesenchymal tumors. Acta Obstet Gynecol Scand 2014; 93: pp. 261-268.
15. Skorstad M., Kent A., Lieng M.: Preoperative evaluation in women with uterine leiomyosarcoma. A nationwide cohort study. Acta Obstet Gynecol Scand 2016; 95: pp. 1228-1234.
16. Lee H.J., Park J.Y., Lee J.J., et. al.: Comparison of MRI and 18F-FDG PET/CT in the preoperative evaluation of uterine carcinosarcoma. Gynecol Oncol 2016; 140: pp. 409-414.
17. Barral M., Placé V., Dautry R., et. al.: Magnetic resonance imaging features of uterine sarcoma and mimickers. Abdom Radiol (NY) 2017; 42: pp. 1762-1772.
18. Kamishima Y., Takeuchi M., Kawai T., et. al.: A predictive diagnostic model using multiparametric MRI for differentiating uterine carcinosarcoma from carcinoma of the uterine corpus. Jpn J Radiol 2017; 35: pp. 472-483.
19. Lakhman Y., Veeraraghavan H., Chaim J., et. al.: Differentiation of uterine leiomyosarcoma from atypical leiomyoma: diagnostic accuracy of qualitative MR imaging features and feasibility of texture analysis. Eur Radiol 2017; 27: pp. 2903-2915.
20. Lin G., Yang L.Y., Huang Y.T., et. al.: Comparison of the diagnostic accuracy of contrast-enhanced MRI and diffusion-weighted MRI in the differentiation between uterine leiomyosarcoma/smooth muscle tumor with uncertain malignant potential and benign leiomyoma. J Magn Reson Imaging 2016; 43: pp. 333-342.
21. Takeuchi M., Matsuzaki K., Harada M.: Carcinosarcoma of the uterus: MRI findings including diffusion-weighted imaging and MR spectroscopy. Acta Radiol 2016; 57: pp. 1277-1284.
22. Takahashi M., Kozawa E., Tanisaka M., et. al.: Utility of histogram analysis of apparent diffusion coefficient maps obtained using 3.0T MRI for distinguishing uterine carcinosarcoma from endometrial carcinoma. J Magn Reson Imaging 2016; 43: pp. 1301-1307.
23. Sato K., Yuasa N., Fujita M., et. al.: Clinical application of diffusion-weighted imaging for preoperative differentiation between uterine leiomyoma and leiomyosarcoma. Am J Obstet Gynecol 2014; 210: pp. 368. e1-8
24. Li H.M., Liu J., Qiang J.W., et. al.: Diffusion-weighted imaging for differentiating uterine leiomyosarcoma from degenerated leiomyoma. J Comput Assist Tomogr 2017; 41: pp. 599-606.
25. Zhang G.F., Zhang H., Tian X.M., et. al.: Magnetic resonance and diffusion-weighted imaging in categorization of uterine sarcomas: correlation with pathological findings. Clin Imaging 2014; 38: pp. 836-844.
26. Niedermayer S., Sourbron S., Prompona M., et. al.: Dose response of the intravascular contrast agent gadofosveset trisodium in MR perfusion imaging of the myocardium using a quantitative evaluation. Int J Cardiovasc Imaging 2013; 29: pp. 1527-1536.
27. Kuhl C.K., Schild H.H., Morakkabati N.: Dynamic bilateral contrast-enhanced MR imaging of the breast: trade-off between spatial and temporal resolution. Radiology 2005; 236: pp. 789-800.
28. Potikul C., Tangjitgamol S., Khunnarong J., et. al.: Uterine sarcoma: clinical presentation, treatment and survival outcomes in Thailand. Asian Pac J Cancer Prev 2016; 17: pp. 1759-1767.
29. Lee C.H., Nucci M.R.: Endometrial stromal sarcoma-the new genetic paradigm. Histopathology 2015; 67: pp. 1-19.
30. Lasmar R.B., Lasmar B.P.: The role of leiomyomas in the genesis of abnormal uterine bleeding (AUB). Best Pract Res Clin Obstet Gynaecol 2017; 40: pp. 82-88.
31. Goto A., Takeuchi S., Sugimura K., et. al.: Usefulness of Gd-DTPA contrast-enhanced dynamic MRI and serum determination of LDH and its isozymes in the differential diagnosis of leiomyosarcoma from degenerated leiomyoma of the uterus. Int J Gynecol Cancer 2002; 12: pp. 354-361.
32. Testa A.C., Di Legge A., Bonatti M., et. al.: Imaging techniques for evaluation of uterine myomas. Best Pract Res Clin Obstet Gynaecol 2016; 34: pp. 37-53.
33. Feng W., Malpica A., Robboy S.J., et. al.: Prognostic value of the diagnostic criteria distinguishing endometrial stromal sarcoma, low grade from undifferentiated endometrial sarcoma, 2 entities within the invasive endometrial stromal neoplasia family. Int J Gynecol Pathol 2013; 32: pp. 299-306.
34. Wu T.I., Yen T.C., Lai C.H.: Clinical presentation and diagnosis of uterine sarcoma, including imaging. Best Pract Res Clin Obstet Gynaecol 2011; 25: pp. 681-689.
35. Inoue C., Fujii S., Kaneda S., et. al.: Correlation of apparent diffusion coefficient value with prognostic parameters of endometrioid carcinoma. J Magn Reson Imaging 2015; 41: pp. 213-219.
36. Poncelet C., Fauvet R., Feldmann G., et. al.: Prognostic value of von Willebrand factor, CD34, CD31, and vascular endothelial growth factor expression in women with uterine leiomyosarcomas. J Surg Oncol 2004; 86: pp. 84-90.