
Rationale and Objectives
Mild cognitive impairment has been regarded as a pre-Alzheimer condition, but some patients do not develop dementia. The authors’ objective was to determine whether findings from a combined use of H1 magnetic resonance spectroscopy (MRS), perfusion imaging (PI), and diffusion-weighted imaging (DWI) would predict conversion from amnesic mild cognitive impairment to dementia and to compare the diagnostic accuracy in discriminating patients with probable Alzheimer disease (AD), mixed dementia (MD), Lewy body dementia (LBD), pre-Alzheimer disease mild cognitive impairment (MCI), vascular MCI (VaMCI), and anxious or depression patients with cognitive impairment (DeMCI).
Materials and Methods
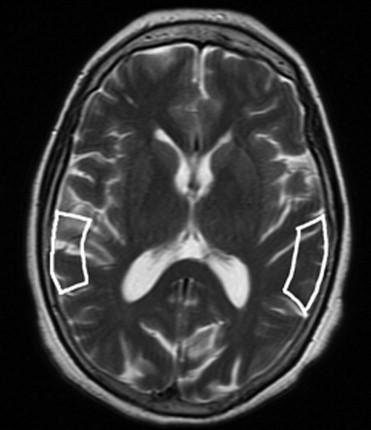
A longitudinal cohort of 119 consecutive and incident subjects (73 women, 46 men; age 70 ± 9.5 years) who fulfilled the criteria of amnesic MCI was followed for a mean period of 29 months. At baseline, a neuropsychological examination and standard blood test were performed, and different areas were examined by proton MRS, PI, and DWI. Among the group of patients considered to have AD, we also included patients with MD because these patients have a neurodegenerative component.
Results
After the follow-up period, 54 patients were considered as converted to dementia (49 with AD; 5 with LBD), 28 patients as MCI, 22 patients as DeMCI, and 15 patients as VaMCI. We found that N-acetylaspartate (NAA)/creatine (Cr) ratios in posterior cingulated gyri (PCG) predict the conversion to probable AD with a sensitivity of 82% and specificity of 72%, and NAA/Cr ratios in the left occipital cortex (LOC) had a sensitivity of 78% and specificity of 69%. When we used spectroscopy in the PCG and LOC to differentiate the types of MCI and dementias, we found significance differences in NAA/Cr, NAA/myoinositol (mI), NAA/choline (Cho), mI/NAA, and Cho/Cr ratios. The apparent diffusion coefficient (ADC) values in the right hippocampus showed differences in patients with LBD and DeMCI ( P = .003), LBD with MCI ( P = 0.48), and LBD and VaMCI ( P = .009).
Conclusions
NAA/Cr ratios in PCG and LOC can predict the conversion from MCI to dementia with high sensitivity and specificity. MRS can differentiate AD from MCI, but cannot differentiate the types of MCI. DWI in the right hippocampus presents higher values of ADC in LBD and allows differentiating it from MCI.
The identification of a group of people at risk of developing dementia, and Alzheimer’s disease (AD) in particular, is of major economic importance, particularly if preventive strategies or therapeutic action are to be developed. This challenge explains the popularity of the concept of mild cognitive impairment (MCI) and its wide application in the epidemiologic, clinical, paraclinical, and therapeutic domains.
The diagnostic criteria for MCI are based solely on clinical evaluation ( ). The difficulties in defining the limits of this concept and the need to characterize its different subtypes may necessitate the wider use of imaging in the future.
Get Radiology Tree app to read full this article<
Get Radiology Tree app to read full this article<
Get Radiology Tree app to read full this article<
Get Radiology Tree app to read full this article<
Get Radiology Tree app to read full this article<
Get Radiology Tree app to read full this article<
Get Radiology Tree app to read full this article<
Get Radiology Tree app to read full this article<
Get Radiology Tree app to read full this article<
Material and methods
Patients
Get Radiology Tree app to read full this article<
Get Radiology Tree app to read full this article<
Get Radiology Tree app to read full this article<
Get Radiology Tree app to read full this article<
MRI, MRS, Diffusion MRI, and Perfusion MRI Studies
Get Radiology Tree app to read full this article<
MRI
Get Radiology Tree app to read full this article<
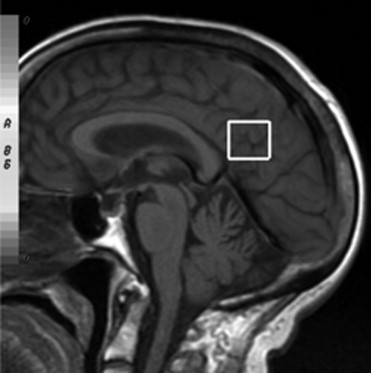
MRS
Get Radiology Tree app to read full this article<
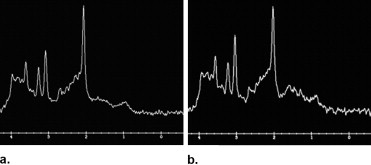
Get Radiology Tree app to read full this article<
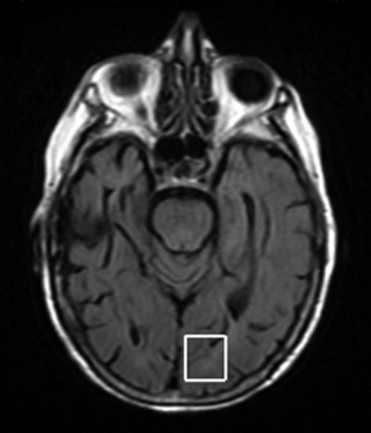
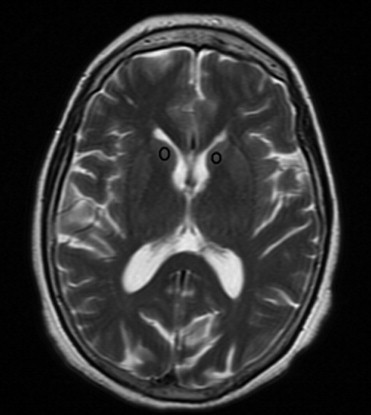
Diffusion
Get Radiology Tree app to read full this article<
Get Radiology Tree app to read full this article<
Perfusion
Get Radiology Tree app to read full this article<
Get Radiology Tree app to read full this article<
Get Radiology Tree app to read full this article<
Statistical Analysis
Get Radiology Tree app to read full this article<
Get Radiology Tree app to read full this article<
Results
Get Radiology Tree app to read full this article<
Get Radiology Tree app to read full this article<
Get Radiology Tree app to read full this article<
Table 1
ANOVA for Different Groups (AD, DeMCI, LBD, MCI, VaMCI) with Spectroscopy
Spectroscopy ANOVA F_P_ Value LOC NAA/Cr 9.193 <.0001 NAA/mI 3.689 .007 Cho/Cr 2.825 .028 mI/NAA 3.64 .008 NAA/Cho 0.64 .64 mI/Cr 0.912 .46 PCG NAA/Cr 14.585 <.0001 NAA/mI 5.283 .001 mI/NAA 0.95 .44 NAA/Cho 5.21 .0007 Cho/Cr 0.545 .703 mI/Cr CI 1.03 .395
AD: Alzheimer’s disease; ANOVA: analysis of variance; Cho: choline; Cr: creatine; DeMCI: depression patients with mild cognitive impairment; LBD: Lewy body dementia; LOC: left occipital cortex; MCI: mild cognitive impairment; mI: myoinositol; NAA: N-acetylaspartate; PCG: posterior cingulated gyri; VaMCI: vascular mild cognitive impairment.
Table 2
ANOVA for Different Groups (AD, DeMCI, LBD, MCI, VaMCI) with Perfusion
Perfusion ANOVA F_P_ Value Right Hippocampus 0.887 .475 Occipital 1.095 .363 Temporoparietal 0.772 .546 Posterior cingulated gyrus 1.56 .191 sensitive-motor 2.1 .086 Frontal 0.944 .442 Left Hippocampus 0.,846 .499 Occipital 2.198 .074 Temporoparietal 1.363 .252 Posterior cingulated gyrus 1.763 .142 Sensitive-motor 1.97 .104 Frontal 0.818 .516
AD: Alzheimer’s disease; ANOVA: analysis of variance; DeMCI: depression patients with mild cognitive impairment; LBD: Lewy body dementia; MCI: mild cognitive impairment; VaMCI: vascular mild cognitive impairment.
Table 3
ANOVA for Differentiate Groups (AD, DeMCI, LBD, MCI, VaMCI) with Diffusion
Diffusion ANOVA F_P_ Value Right Hippocampus 4.361 .003 Temporal 1.058 .383 Occipital 0.855 .495 Caudate nucleolus 0.6 .664 Posterior cingulated gyrus 0.145 .965 Parietal white matter 0.194 .941 Frontal white matter 0.16 .958 Left Hippocampus 2.198 .076 Temporal 0.794 .532 Occipital 0.431 .786 Caudate nucleous 0.293 .882 Posterior cingulated gyrus 0.2 .937 Parietal white matter 0.276 .893 Frontal white matter 0.78 .542
AD: Alzheimer’s disease; ANOVA: analysis of variance; DeMCI: depression patients with mild cognitive impairment; LBD: Lewy body dementia; MCI: mild cognitive impairment; VaMCI: vascular mild cognitive impairment.
Get Radiology Tree app to read full this article<
Get Radiology Tree app to read full this article<
Table 4
Intergroup Bonferroni Correction for Significance Statistical ANOVA Results in Spectroscopy, Diffusion, and Perfusion
ANOVA Bonferroni LOC Spectroscopy PCG Spectroscopy Diffusion NAA/Cr NAA/mI Cho/Cr mI/NAA NAA/Cr NAA/mI NAA/Cho Right Hippocampus_P_ Value_P_ Value_P_ Value_P_ Value_P_ Value_P_ Value_P_ Value_P_ Value AD DeMCI .0011 .0178 1 .0361 <.00001 .0008 .0002 .2285 LBD 1 1 1 1 .3975 1 1 .0802 MCI <.00001 .0623 .019 .0408 .0002 .0139 .1885 1 VaMCI .0033 1 .751 1 .0031 .5792 1 1 DeMCI LBD 1 .5481 1 .5441 .8524 1 .6266 .0027 MCI 1 1 .539 1 .0774 1 .4585 1 VaMCI 1 1 1 1 0,2935 1 0,4266 1 LBD MCI .9849 1 1 .7045 1 1 1 .0475 VaMCI 1 1 1 1 1 1 1 .0094 MCI VaMCI 1 1 1 1 1 1 1 1
AD: Alzheimer’s disease; ANOVA: analysis of variance; Cho: choline; Cr: creatine; DeMCI: depression patients with mild cognitive impairment; LBD: Lewy body dementia; LOC: left occipital cortex; MCI: mild cognitive impairment; mI: myoinositol; NAA: N-acetylaspartate; PCG: posterior cingulated gyri; VaMCI: vascular mild cognitive impairment.
Get Radiology Tree app to read full this article<
Get Radiology Tree app to read full this article<
Get Radiology Tree app to read full this article<
Get Radiology Tree app to read full this article<
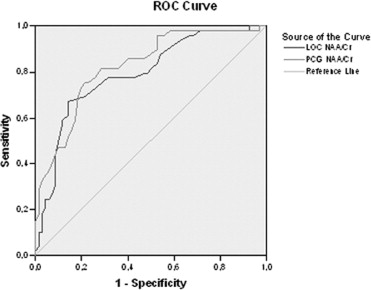
Table 5
Significance Statistical Receiver-operating Characteristic (ROC) Curves to Evaluate the Prediction of Conversion from MCI to Probable AD in Spectroscopy, Diffusion, and Perfusion
Test Results Area Under Curve_p_ Value Lower Bound Upper Bound Cut Point Se Sp Spectroscopy LOC NAA/Cr 0.792 <.0001 0.709 0.875 <1.57 78% 69% NAA/mI 0.672 .002 0.572 0,771 <2.47 70% 60% mI/NAA 0.681 .001 0.58 0.78 >0.40 71% 61% Cho/Cr 0.668 .002 0.569 0.767 >0.60 71% 57% PCG NAA/Cr 0.823 <.0001 0.748 0.899 <1.40 82% 72% NAA/mI 0.75 <.0001 0.657 0.842 <2.02 71% 72% mI/NAA 0.766 <.0001 0.675 0.856 >0.47 79% 67% NAA/Cho 0.679 <.0001 0.582 0.777 <2.24 70% 57%
AD: Alzheimer’s disease; ANOVA: analysis of variance; Cho: choline; Cr: creatine; DeMCI: depression patients with mild cognitive impairment; LBD: Lewy body dementia; LOC: left occipital cortex; MCI: mild cognitive impairment; mI: myoinositol; NAA: N-acetylaspartate; PCG: posterior cingulated gyri; Se: sensibility; Sp: specificity; VaMCI: vascular mild cognitive impairment.
Get Radiology Tree app to read full this article<
Get Radiology Tree app to read full this article<
Get Radiology Tree app to read full this article<
Get Radiology Tree app to read full this article<
Discussion
Get Radiology Tree app to read full this article<
Get Radiology Tree app to read full this article<
Get Radiology Tree app to read full this article<
Get Radiology Tree app to read full this article<
Get Radiology Tree app to read full this article<
Get Radiology Tree app to read full this article<
Get Radiology Tree app to read full this article<
Get Radiology Tree app to read full this article<
Get Radiology Tree app to read full this article<
Get Radiology Tree app to read full this article<
Get Radiology Tree app to read full this article<
Get Radiology Tree app to read full this article<
Get Radiology Tree app to read full this article<
Get Radiology Tree app to read full this article<
Get Radiology Tree app to read full this article<
Get Radiology Tree app to read full this article<
Conclusions
Get Radiology Tree app to read full this article<
Get Radiology Tree app to read full this article<
References
1. Grober E., Dickson D., Sliwinski M.J., et. al.: Memory and mental status correlates of modified Braak staging. Neurobiol Aging 1999; 20: pp. 573-579.
2. Petersen R.C., Smith G.E., Ivnik R.J., et. al.: Apolipoprotein E status as a predictor of the development of Alzheimer’s disease in memory impaired individuals. JAMA 1995; 273: pp. 1274-1278.
3. Smith G.E., Petersen R.C., Parisi J.E., et. al.: Definition, course, and outcome of mild cognitive impairment. Aging Neuropsiychol Cogn 1996; 3: pp. 141-147.
4. Portet F., Ousset P.J., Visser P.J., et. al., MCI Working Group of the European Consortium on Alzheimer’s Disease: Mild cognitive impairment (MCI) in medical practice: a critical review of the concept and new diagnostic procedure. J Neurol Neurosurg Psychiatry 2006; 77: pp. 714-718.
5. Wolf H., Jelic V., Gertz H.J., et. al.: A critical discussion of the role of neuroimaging in mild cognitive impairment. Acta Neurol Scand Suppl 2003; 179: pp. 52-76.
6. Krishnan S., Talley B.D., Slavin M.J., et. al.: Current status of functional MR imaging, perfusion-weighted imaging, and diffusion-tensor imaging in Alzheimer’s disease diagnosis and research. Neuroimaging Clin N Am 2005; 15: pp. 853-868.
7. Valenzuela M.J., Sachdev P.: Magnetic resonance spectroscopy in AD. Neurology 2001; 56: pp. 592-598.
8. Modrego P.J., Fayed N., Pina M.A.: Conversion from mild cognitive impairment to probable Alzheimer’s disease predicted by brain magnetic resonance spectroscopy. Am J Psychiatry 2005; 162: pp. 667-675.
9. Modrego P.J., Pina M.A., Fayed N., et. al.: Changes in metabolite ratios after treatment with rivastigmine in Alzheimer’s disease: a nonrandomised controlled trial with magnetic resonance spectroscopy. CNS Drugs 2006; 20: pp. 867-877.
10. Kantarci K., Weigand S.D., Petersen R.C., et. al.: Longitudinal 1H MRS changes in mild cognitive impairment and Alzheimer’s disease. Neurobiol Aging 2007; 28: pp. 1330-1339.
11. Kantarci K., Jack C.R., Xu Y.C., et. al.: Mild cognitive impairment and Alzheimer disease: regional diffusivity of water. Radiology 2001; 219: pp. 101-107.
12. Speck O., Chang L., DeSilva N.M., et. al.: Perfusion MRI of the human brain with dynamic susceptibility contrast: gradient-echo versus spin-echo techniques. J Magn Reson Imaging 2000; 12: pp. 381-387.
13. Harris G.J., Lewis R.F., Satlin A., et. al.: Dynamic susceptibility contrast MRI of regional cerebral blood volume in Alzheimer’s disease. Am J Psychiatry 1996; 153: pp. 721-724.
14. Petersen R.C., Smith G.E., Waring S.C., et. al.: Mild cognitive impairment: clinical characterization and outcome. Arch Neurol 1999; 56: pp. 303-308. correction 56:760.
15. McKhann G., Drachman D., Folstein M., et. al.: Clinical diagnosis of Alzheimer’s disease: report of the NINCDS-ADRDA Work Group under the auspices of Department of Health and Human Services Task Force on Alzheimer’s Disease. Neurology 1984; 34: pp. 939-944.
16. Spreen O., Strauss E.: Geriatric Depression Scale (GDS).Spreen O.Strauss E.A compendium of neuropsychological tests.1998.Oxford University PressNew York:pp. 612-616.
17. Talairach J., Tournoux P.: Co-planar stereotaxic atlas of the human brain.1988.ThiemeNew York
18. Belliveau J.W., Rosen B.R., Kantor H.L., et. al.: Functional cerebral imaging by susceptibility-contrast NMR. Magn Reson Med 1990; 14: pp. 538-546.
19. Harris G.J., Lewis R.F., Satlin A., et. al.: Dynamic susceptibility contrast MR imaging of regional cerebral blood volume in Alzheimer disease: a promising alternative to nuclear medicine. AJNR Am J Neuroradiol 1998; 19: pp. 1727-1732.
20. Harris G.J., Lewis R.F., Satlin A., et. al.: Dynamic susceptibility contrast MRI of regional cerebral blood volume in Alzheimer’s disease. Am J Psychiatry 1996; 153: pp. 721-724.
21. Talbot P.R., Lloyd J.J., Snowden J.S., et. al.: Choice of reference region in the quantification of single-photon emission tomography in primary degenerative dementia. Eur J Nucl Med 1994; 21: pp. 503-508.
22. Reischies F.M., Neu P.: Comorbidity of mild cognitive disorder and depression—a neuropsychological analysis. Eur Arch Psychiatry Clin Neurosci 2000; 250: pp. 186-193.
23. Holmes C., Cairns N., Lantos P., et. al.: Validity of current clinical criteria for Alzheimer’s disease, vascular dementia and dementia with Lewy bodies. Br J Psychiatry 1999; 174: pp. 45-50.
24. Evans M., Mottram P.: Diagnosis of depression in elderly patients. Adv Psychiatr Trends 2000; 6: pp. 49-56.
25. Gottfries C.: Late life depression. Eur Arch Psychatry Clin Neurosci 2001; 251: pp. 57-61.
26. Tian J., Bucks R.S., Haworth J., et. al.: Neuropsychological prediction of conversion to dementia from questionable dementia: statistically significant but not yet clinically useful. J Neurol Neurosurg Psychiatry 2003; 74: pp. 433-438.
27. de Leon M.J., Golomb J., George A.E., et. al.: The radiologic prediction of Alzheimer disease: the atrophic hippocampal formation. AJNR Am J Neuroradiol 1993; 14: pp. 897-906.
28. Du A.T., Schuff N., Amend D., et. al.: Magnetic resonance imaging of the entorhinal cortex and hippocampus in mild cognitive impairment and Alzheimer’s disease. J Neurol Neurosurg Psychiatry 2001; 71: pp. 441-447.
29. Jack C.R., Petersen R.C., Xu Y.C., et. al.: Prediction of AD with MRI-based hippocampal volume in mild cognitive impairment. Neurology 1999; 52: pp. 1397-1403.
30. Mega M.S.: The entorhinal cortex in Alzheimer’s disease. J Neurol Neurosurg Psychiatry 2001; 71: pp. 431-432.
31. Golomb J., de Leon M.J., Kluger A., et. al.: Hippocampal atrophy in normal aging. Arch Neurol 1993; 50: pp. 967-973.
32. Nicolay K., Braun K.P., Graaf R.A., et. al.: Diffusion NMR spectroscopy. NMR Biomed 2001; 14: pp. 94-111.
33. Lu D., Margouleff C., Rubin E., et. al.: Temporal lobe epilepsy: correlation of proton magnetic resonance spectroscopy and 18F-fluorodeoxyglucose positron emission tomography. Magn Reson Med 1997; 37: pp. 18-23.
34. Mielke R., Schopphoff H.H., Kugel H., et. al.: Relation between 1H MR spectroscopic imaging and regional cerebral glucose metabolism in Alzheimer’s disease. Int J Neurosci 2001; 107: pp. 233-245.
35. Frahm J., Krueger G., Merboldt K.D., et. al.: Dynamic NMR studies of perfusion and oxidative metabolism during focal brain activation. Adv Exp Med Biol 1997; 413: pp. 195-203.
36. Braak H., Braak E.: Neuropathological staging of Alzheimer-related changes. Acta Neuropathol 1991; 82: pp. 239-259.
37. Kantarci K., Jack C.R., Xu Y.C., et. al.: Regional metabolic patterns in mild cognitive impairment and Alzheimer’s disease: A 1H MRS study. Neurology 2000; 55: pp. 210-217.
38. Miller B.L., Moats R.A., Shonk T., et. al.: Alzheimer disease: depiction of increased cerebral myo-inositol with proton MR spectroscopy. Radiology 1993; 187: pp. 433-437.
39. Rai G.S., McConnell J.R., Waldman A., et. al.: Brain proton spectroscopy in dementia: an aid to clinical diagnosis. Lancet 1999; 353: pp. 1063-1064.
40. Shonk T.K., Moats R.A., Gifford P., et. al.: Probable Alzheimer disease: diagnosis with proton MR spectroscopy. Radiology 1995; 195: pp. 65-72.
41. Kantarci K., Xu Y., Shiung M.M., et. al.: Comparative diagnostic utility of different MR modalities in mild cognitive impairment and Alzheimer’s disease. Dement Geriatr Cogn Disord 2002; 14: pp. 198-207.
42. Kantarci K., Petersen R.C., Boeve B.F., et. al.: 1H MR spectroscopy in common dementias. Neurology 2004; 63: pp. 1393-1398.
43. Molina J.A., Garcia-Segura J.M., Benito-Leon J., et. al.: Proton magnetic resonance spectroscopy in dementia with Lewy bodies. Eur Neurol 2002; 48: pp. 158-163.
44. Tiraboschi P., Hansen L.A., Alford M., et. al.: Early and widespread cholinergic losses differentiate dementia with Lewy bodies from Alzheimer disease. Arch Gen Psychiatry 2002; 59: pp. 946-951.
45. Kantarci K, Weigand S, Petersen R, et al. Longitudinal 1H MRS changes in mild cognitive impairment and Alzheimer’s disease. Neurobiol Aging. 2006 Jul 20.
46. Martínez-Bisbal M.C., Arana E., Martí-Bonmatí L., Mollá E., Celda B.: Cognitive impairment: classification by 1H magnetic resonance spectroscopy. Eur J Neurol 2004; 11: pp. 187-193.
47. Ernst T., Chang L., Melchor R., et. al.: Frontotemporal dementia and early Alzheimer disease: differentiation with frontal lobe H-1 MR spectroscopy. Radiology 1997; 203: pp. 829-836.
48. Doraiswamy P.M., Barboriak D., Krishnan K.R.R., et. al.: Brain 1H-MR spectroscopy in subjects at risk for Alzheimer’s disease. Neurobiol Aging 2001; 22: pp. 338-339.
49. Kantarci K., Petersen R.C., Boeve B.F., et. al.: DWI predicts future progression to Alzheimer disease in amnestic mild cognitive impairment. Neurology 2005; 64: pp. 902-904.
50. Renshaw P.F., Levin J.M., Kaufman M.J., et. al.: Dynamic susceptibility contrast magnetic resonance imaging in neuropsychiatry: present utility and future promise. Eur Radiol 1997; 7: pp. 216-221.
51. Perneczky R., Hartmann J., Grimmer T., et. al.: Cerebral metabolic correlates of the clinical dementia rating scale in mild cognitive impairment. J Geriatr Psychiatry Neurol 2007; 20: pp. 84-88.