
Rationale and Objectives
Firefly luciferase (Fluc) reporter gene is an authentic marker for surviving stem cells. However, it is unable to visualize the intramyocardial delivery of stem cells or their impact on cardiac function. The investigators demonstrate that bioluminescence imaging (BLI) combined with magnetic resonance imaging (MRI) allows better assessment of cell delivery and the impact on post–myocardial infarction remodeling.
Materials and Methods
Murine embryonic stem cells (0.3 million) were double-labeled with Fluc and superparamagnetic iron oxide particles and injected into the infarct border zone of athymic rat hearts. BLI and MRI were performed serially up to 2 months after injection, followed by immunohistochemistry.
Results
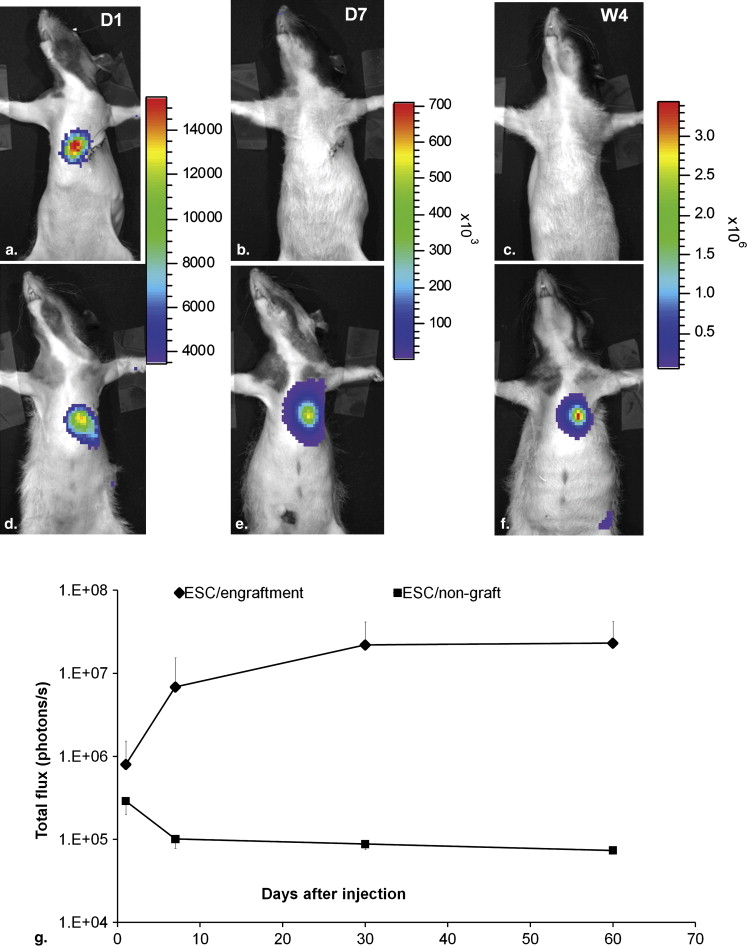
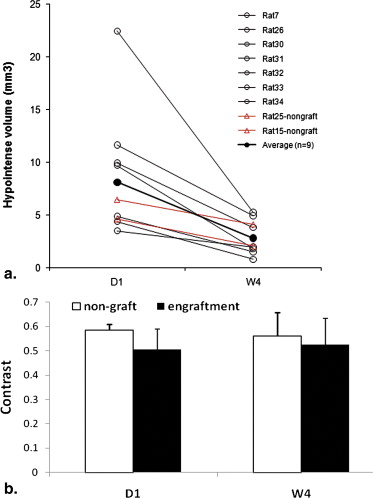
Dual-modality imaging was able to verify the initial intramyocardial delivery of the cells and their survival status. Over time, BLI signal increased in seven of nine hearts and disappeared in the other two hearts. The divergence of BLI signal over time was supported by MRI findings. Left ventricular ejection fraction and fractional shortening estimated by MRI suggested that cell engraftment mediated a positive impact on post–myocardial infarction remodeling. Two months after intramyocardial injection, superparamagnetic iron oxide–associated signals facilitated the localization of the injection site.
Conclusions
Dual-modality imaging has the unique ability to monitor cell delivery, survival status, graft morphology, and impact on post–myocardial infarction remodeling.
Magnetic resonance imaging (MRI)–based tracking of stem cells grafted in the heart is especially challenging in rodent models. Cardiac and respiration motion introduce significant artifacts, particularly in the setting of their high heart rates. Electrocardiographically gated MRI has been successful in visualizing superparamagnetic iron oxide (SPIO) particle–labeled stem cells grafted in the myocardium of mouse and rat models . However, later studies revealed that the SPIO-MRI method was insensitive to monitor cell survival over time . In comparison, approaches using reporter genes to “label” stem cells have shown advantages in tracking cell survival and proliferation in the heart . Compared to other reporter genes, the firefly luciferase (Fluc) reporter combined with bioluminescence imaging (BLI) provides a sensitive, simple, and inexpensive method for stem cell tracking in small animals. Although it is highly sensitive, BLI is poor in resolving the signal in a tomographic fashion. In the past, BLI and MRI were examined for monitoring stem cell interventions in rodent models of myocardial infarction (MI) . However, the unique strength of combining the two modalities to track the same population of stem cells over time has not been demonstrated.
To visualize the stem cells by both BLI and MRI, we used a double-labeling strategy in which Fluc-expressing murine embryonic stem cells (ESCs) were labeled with SPIO particles. Murine ESCs were rejected in immune competent allogeneic mice . Therefore, immune-deficient or syngenic animals must be used to achieve long-term monitoring of ESC survival by BLI. The above consideration combined with our intention to generate a reperfused MI model led us to choose athymic nude rats, which are suitable for demonstrating the utility of dual-modality imaging. Indeed, the MI model in nude rats has been used to receive stem cells of human and mouse origin in many previous studies .
Materials and methods
ESCs Stably Expressing Fluc Reporter Gene and Labeled with SPIO Particles
Get Radiology Tree app to read full this article<
Get Radiology Tree app to read full this article<
Get Radiology Tree app to read full this article<
Surgical Procedures to Induce MI and Intramyocardial Injection of Stem Cells
Get Radiology Tree app to read full this article<
Experimental Groups
Get Radiology Tree app to read full this article<
Table 1
Reasons for Exclusion and Final Group Size
Group Total Animals Used Death After Surgery Improper Injection of Cells ∗ Infarct Size < 10% or >30% of LV Mass Final Group Size Control 10 1 NA 2 7 ESC treated 24 4 6 5 9
ESC, embryonic stem cell; LV, left ventricular; NA, not applicable.
Get Radiology Tree app to read full this article<
Get Radiology Tree app to read full this article<
In Vivo BLI and MRI
Imaging Schedule
Get Radiology Tree app to read full this article<
BLI
Get Radiology Tree app to read full this article<
MRI
Get Radiology Tree app to read full this article<
Analyses of Bioluminescence and Magnetic Resonance Images
Get Radiology Tree app to read full this article<
Get Radiology Tree app to read full this article<
Get Radiology Tree app to read full this article<
Get Radiology Tree app to read full this article<
Histologic Analysis to Identify Grafted Cells, Macrophages, and Cardiac Differentiation
Get Radiology Tree app to read full this article<
Get Radiology Tree app to read full this article<
Statistical Analysis
Get Radiology Tree app to read full this article<
Results
Viability and Labeling Efficiency and Iron Content
Get Radiology Tree app to read full this article<
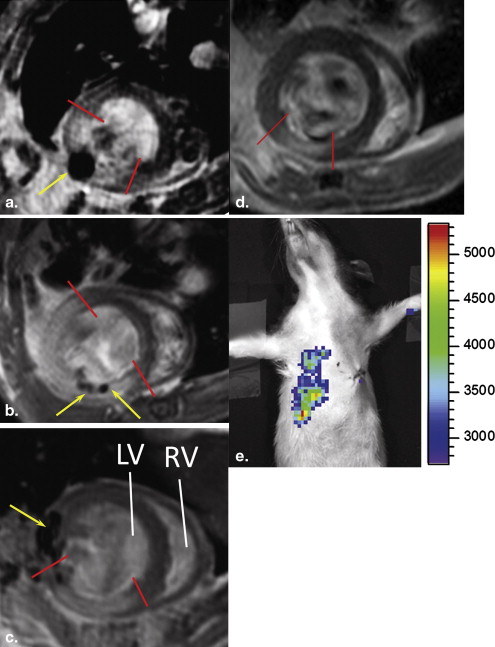
Both MRI and BLI Are Necessary to Confirm Intramyocardial Delivery and Survival of Stem Cells
Get Radiology Tree app to read full this article<
Get Radiology Tree app to read full this article<
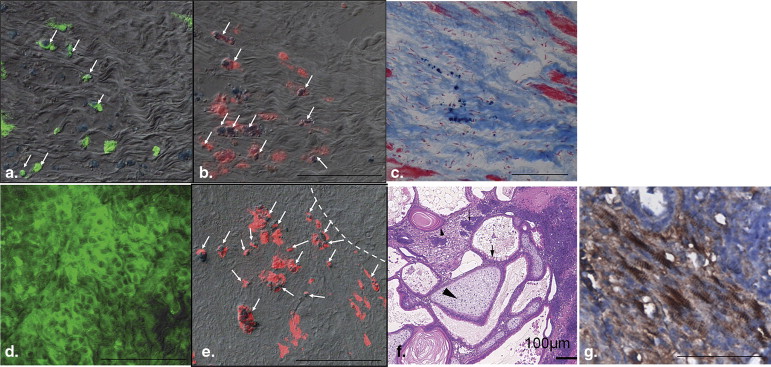
Two Outcomes From the ESC-treated Group Revealed by Imaging and Confirmed by Histology
Get Radiology Tree app to read full this article<
Table 2
Myocardial Wall Thickness in ESC-treated and Control Groups at Week 4
Wall Thickness at Week 4 Septal Anterior Lateral Posterior ESC treated Nongraft ( n = 2) 1.3 ± 0.2 1.5 ± 0.1 1.5 ± 0.2 1.5 ± 0.3 Engraftment ( n = 7) 1.3 ± 0.1 1.7 ± 0.2 † 2.2 ± 0.9 † 1.6 ± 0.2 † Controls ( n = 7) 1.3 ± 0.1 1.4 ± 0.2 1.2 ± 0.3 † 1.2 ± 0.1 Wall thickness at day 1 ( n = 16) ∗ 1.4 ± 0.2 1.4 ± 0.3 1.5 ± 0.2 1.3 ± 0.3
Three short-axis slices (3 mm apart) with the middle slice at the midventricular level were used. Diastolic wall thickness was measured in the septal, anterior, lateral, and posterior quadrants using a line connecting the centroid of the left ventricular wall and the vertex of the epicardium border.
ESC, embryonic stem cell.
Get Radiology Tree app to read full this article<
Get Radiology Tree app to read full this article<
Get Radiology Tree app to read full this article<
Get Radiology Tree app to read full this article<
Get Radiology Tree app to read full this article<
Get Radiology Tree app to read full this article<
![Figure 5, Fractional shortening of the myocardial wall of the embryonic stem cell–treated and control groups. Hearts at day 1 from the (a) engraftment subgroup, (b) nongraft subgroup, and (c) control group. (d–f) Corresponding hearts at week 4. The anterior (border 1 [b1]) and posterior (border 2 [b2]) borders of the infarct were defined on images as follows: at day 1, b1 and b2 are placed at the boundary of the infarct defined on delayed hyperenhancement images (a–c) . At week 4, boundaries of the graft were defined as b1 and b2 in the engraftment subgroup (d) ; borders defined in (b) were transferred to images of the corresponding location for the nongraft hearts (e) ; boundaries of the dyskinetic region identified on cine images were defined as b1 and b2 in the control hearts (f) . Arrows point to the region where myocardial wall became thin. Fractional shortening was measured from b1, b2, and septum (remote) on magnetic resonance images at day 1 and week 4 (g) . # P < .05 compared to the septum (remote region) at day 1; ∗ P < .05 comparing day 1 and week 4. Statistical analysis was not applied in nongraft subgroup because of small size ( n = 2).](https://storage.googleapis.com/dl.dentistrykey.com/clinical/UtilityofDualmodalityBioluminescenceandMRIinMonitoringStemCellSurvivalandImpactonPostMyocardialInfarctRemodeling/4_1s20S1076633210005155.jpg)
Get Radiology Tree app to read full this article<
SPIO-related Signal Helps Localize to the Injection Site
Get Radiology Tree app to read full this article<
Global and Regional Cardiac Function
Get Radiology Tree app to read full this article<
Table 3
Global LV Function at Day 1 and Week 4 in the ESC-treated and Control Groups
Day 1 Week 4 Group EDV (μl) ESV (μl) LVEF (%) EDV (μl) ESV (μl) LVEF (%) ESC treated ( n = 9) 232 ± 61 72 ± 50 69 ± 13 276 ± 55 ∗ 66 ± 34 ∗ 76 ± 11 Control ( n = 7) 227 ± 69 89 ± 26 62 ± 11 412 ± 111 † 181 ± 105 59 ± 18
EDV, end-diastolic volume; ESV, end-systolic volume; LVEF, left ventricular ejection fraction.
Get Radiology Tree app to read full this article<
Get Radiology Tree app to read full this article<
Get Radiology Tree app to read full this article<
Get Radiology Tree app to read full this article<
Discussion
Get Radiology Tree app to read full this article<
Get Radiology Tree app to read full this article<
Get Radiology Tree app to read full this article<
Get Radiology Tree app to read full this article<
Get Radiology Tree app to read full this article<
Conclusions
Get Radiology Tree app to read full this article<
Get Radiology Tree app to read full this article<
References
1. Cahill K.S., Germain S., Byrne B.J., et. al.: Non-invasive analysis of myoblast transplants in rodent cardiac muscle. Int J Cardiovasc Imaging 2004; 20: pp. 593-598.
2. Himes N., Min J.Y., Lee R., et. al.: In vivo MRI of embryonic stem cells in a mouse model of myocardial infarction. Magn Reson Med 2004; 52: pp. 1214-1219.
3. Stuckey D.J., Carr C.A., Martin-Rendon E., et. al.: Iron particles for noninvasive monitoring of bone marrow stromal cell engraftment into, and isolation of viable engrafted donor cells from, the heart. Stem Cells 2006; 24: pp. 1968-1975.
4. Arai T., Kofidis T., Bulte J.W., et. al.: Dual in vivo magnetic resonance evaluation of magnetically labeled mouse embryonic stem cells and cardiac function at 1.5 T. Magn Reson Med 2006; 55: pp. 203-209.
5. Tallheden T., Nannmark U., Lorentzon M., et. al.: In vivo MR imaging of magnetically labeled human embryonic stem cells. Life Sci 2006; 79: pp. 999-1006.
6. Ebert S.N., Taylor D.G., Nguyen H.L., et. al.: Noninvasive tracking of cardiac embryonic stem cells in vivo using magnetic resonance imaging techniques. Stem Cells 2007; 25: pp. 2936-2944.
7. Hung T.-C., Suzuki Y., Urashima T., et. al.: Multimodality evaluation of the viability of stem cells delivered into different zones of myocardial infarction. Circ Cardiovasc Imaging 2008; 1: pp. 6-13.
8. Qiao H., Zhang H., Zheng Y., et. al.: Embryonic stem cell grafting in normal and infarcted myocardium: serial assessment with MR imaging and PET dual detection. Radiology 2009; 250: pp. 821-829.
9. Chen I.Y., Greve J.M., Gheysens O., et. al.: Comparison of optical bioluminescence reporter gene and superparamagnetic iron oxide MR contrast agent as cell markers for noninvasive imaging of cardiac cell transplantation. Mol Imaging Biol 2009; 11: pp. 178-187.
10. Wu J.C., Chen I.Y., Sundaresan G., et. al.: Molecular imaging of cardiac cell transplantation in living animals using optical bioluminescence and positron emission tomography. Circulation 2003; 108: pp. 1302-1305.
11. Cao F., Lin S., Xie X., et. al.: In vivo visualization of embryonic stem cell survival, proliferation, and migration after cardiac delivery. Circulation 2006; 113: pp. 1005-1014.
12. Qiao H., Surti S., Choi S.R., et. al.: Death and proliferation time course of stem cells transplanted in the myocardium. Mol Imaging Biol 2009; 11: pp. 408-414.
13. Higuchi T., Anton M., Dumler K., et. al.: Combined reporter gene PET and iron oxide MRI for monitoring survival and localization of transplanted cells in the rat heart. J Nucl Med 2009; 50: pp. 1088-1094.
14. Nussbaum J., Minami E., Laflamme M.A., et. al.: Transplantation of undifferentiated murine embryonic stem cells in the heart: teratoma formation and immune response. FASEB J 2007; 21: pp. 1345-1357.
15. Swijnenburg R.J., Schrepfer S., Cao F., et. al.: In vivo imaging of embryonic stem cells reveals patterns of survival and immune rejection following transplantation. Stem Cells Dev 2008; 17: pp. 1023-1029.
16. Laflamme M.A., Chen K.Y., Naumova A.V., et. al.: Cardiomyocytes derived from human embryonic stem cells in pro-survival factors enhance function of infarcted rat hearts. Nat Biotechnol 2007; 25: pp. 1015-1024.
17. Dai W., Field L.J., Rubart M., et. al.: Survival and maturation of human embryonic stem cell-derived cardiomyocytes in rat hearts. J Mol Cell Cardiol 2007; 43: pp. 504-516.
18. Caspi O., Huber I., Kehat I., et. al.: Transplantation of human embryonic stem cell-derived cardiomyocytes improves myocardial performance in infarcted rat hearts. J Am Coll Cardiol 2007; 50: pp. 1884-1893.
19. Min J.-Y., Yang Y., Converso K.L., et. al.: Transplantation of embryonic stem cells improves cardiac function in postinfarcted rats. J Appl Physiol 2002; 92: pp. 288-296.
20. Chung S., Andersson T., Sonntag K.C., Bjorklund L., Isacson O., Kim K.S.: Analysis of different promoter systems for efficient transgene expression in mouse embryonic stem cell lines. Stem Cells 2002; 20: pp. 139-145.
21. Zhou R., Thomas D.H., Qiao H., et. al.: In vivo detection of stem cells grafted in infarcted rat myocardium. J Nucl Med 2005; 46: pp. 816-822.
22. Bhaumik S., Gambhir S.S.: Optical imaging of Renilla luciferase reporter gene expression in living mice. Proc Natl Acad Sci U S A 2002; 99: pp. 377-382.
23. Zhou R., Pickup S., Glickson J.D., Scott C., Ferrari V.A.: Assessment of global and regional myocardial function in the mouse using cine- and tagged MRI. Magn Reson Med 2003; 49: pp. 760-764.
24. Thomas D., Dumont C., Pickup S., et. al.: T1-weighted cine FLASH is superior to IR imaging of post-infarction myocardial viability at 4.7T. J Cardiovasc Magn Reson 2006; 8: pp. 345-352.
25. Yang Z., Berr S.S., Gilson W.D., Toufektsian M.C., French B.A.: Simultaneous evaluation of infarct size and cardiac function in intact mice by contrast-enhanced cardiac magnetic resonance imaging reveals contractile dysfunction in noninfarcted regions early after myocardial infarction. Circulation 2004; 109: pp. 1161-1167.
26. Hou D., Youssef E.A.-S., Brinton T.J., et. al.: Radiolabeled cell distribution after intramyocardial, intracoronary, and interstitial retrograde coronary venous delivery: implications for current clinical trials. Circulation 2005; 112: pp. I-150-I-156.
27. Berry M.F., Engler A.J., Woo Y.J., et. al.: Mesenchymal stem cell injection after myocardial infarction improves myocardial compliance. Am J Physiol Heart Circ Physiol 2006; 290: pp. H2196-H2203.
28. Kattman S.J., Adler E.D., Keller G.M.: Specification of multipotential cardiovascular progenitor cells during embryonic stem cell differentiation and embryonic development. Trends Cardiovasc Med 2007; 17: pp. 240-246.
29. Behfar A., Perez-Terzic C., Faustino R.S., et. al.: Cardiopoietic programming of embryonic stem cells for tumor-free heart repair. J Exp Med 2007; 204: pp. 405-420.