
Rationale and Objectives
Bone age (BA) rating is associated with a considerable rater variability, which would be eliminated with an automated computerized method. The aim of the study was to validate the BoneXpert method, an automated determination of BA, in American children of four ethnicities.
Materials and Methods
The study is based on a publicly available database of hand x-rays of healthy children, established in a previous, National Institutes of Health–funded study. Radiographs of the left hand were recorded between 1993 and 2006 in Los Angeles, including 1100 images with two independent manual BA ratings and 280 additional images for which the manual ratings were not used. Images were evenly split between Caucasian, African American, Hispanic, and Asian children, and the age range was 0–18.99 years.
Results
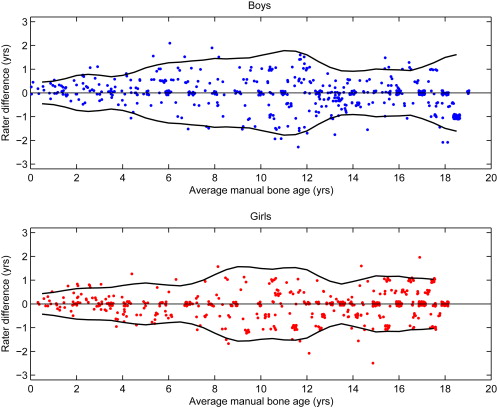
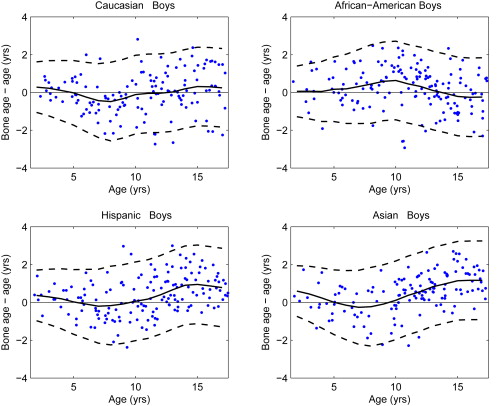
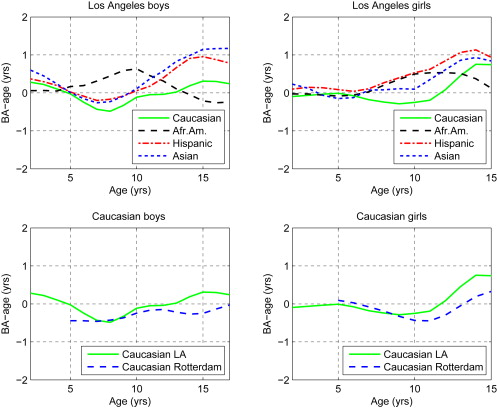
The automated method analyzed all images with BA >2.5 years for boys and >2 years for girls. The root-mean-square (RMS) error between the two manual ratings was 0.63 years, whereas the RMS deviation between the automated BA and the average of the two manual ratings was 0.61 years. The mean BA minus age was computed versus age for each sex and ethnicity. The largest deviation from zero was seen for Hispanic and Asian children older than 12 years, who were about 1 year advanced relative to the Greulich and Pyle standard.
Conclusion
The automated method can analyze images of all ethnicities within a BA range of 2.5–17 years for boys and 2–15 years for girls, and can therefore eliminate the problem with rater variability in BA rating.
Bone age (BA) determination is one of the oldest procedures in pediatric radiology used in the diagnosis of many disorder, and to follow-up on treatment. It is often performed according to the method of Greulich and Pyle (GP) , which has remained unchanged for more than 50 years.
There are two problems related to BA rating: the rating is associated with considerable rater variability , and the interpretation of the BA in relation to the age is complicated by ethnical variations and secular trends. Consequently, the value of BA has been questioned.
Get Radiology Tree app to read full this article<
Get Radiology Tree app to read full this article<
Get Radiology Tree app to read full this article<
Get Radiology Tree app to read full this article<
Materials and methods
Study Data
Get Radiology Tree app to read full this article<
Get Radiology Tree app to read full this article<
Get Radiology Tree app to read full this article<
Get Radiology Tree app to read full this article<
Get Radiology Tree app to read full this article<
Get Radiology Tree app to read full this article<
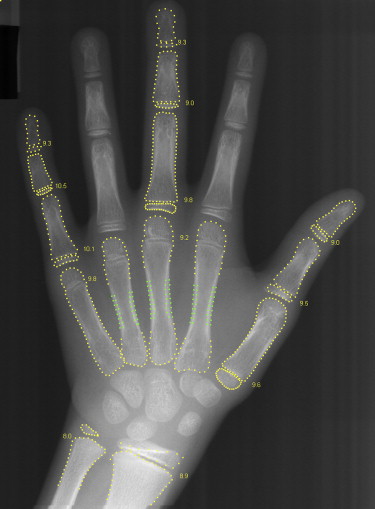
The Automated BA Determination
Get Radiology Tree app to read full this article<
Get Radiology Tree app to read full this article<
Get Radiology Tree app to read full this article<
Get Radiology Tree app to read full this article<
Analysis of Variances
Get Radiology Tree app to read full this article<
R1=I+N(0,s) R
1
=
I
+
N
(
0
,
s
)
R2=I+N(0,s) R
2
=
I
+
N
(
0
,
s
)
Here N(0, s ) denotes the normal distribution with mean 0 and SD s . To get a BA value as close to the gold standard as practically possible, we use the average of the two manual ratings, AR; and we assume that the noise on each rating is independent, so we have
AR=(R1+R2)/2=I+N(0,s/2–√) AR
=
(
R
1
+
R
2
)
/
2
=
I
+
N
(
0
,
s
/
2
)
We estimate s from
R1–R2=N(0,s2–√). R
1
–
R
2
=
N
(
0
,
s
2
)
.
Get Radiology Tree app to read full this article<
Get Radiology Tree app to read full this article<
BX=I+N(0,sBX) BX
=
I
+
N
(
0
,
s
BX
)
The observed deviations between BX and AR are then of the form
BX−AR=N(0,sobs),with BX
-
AR
=
N
(
0
,
s
obs
)
,
with
s2obs=s2BX+s2/2 s
obs
2
=
s
BX
2
+
s
2
/
2
We determine s obs not as the SD between BX and AR, but as the root mean square (RMS) error.
sobs=RMS(BX−AR) s
obs
=
RMS
(
BX
-
AR
)
The RMS error gives larger values than using the SD, but it is needed as a result of the simplified way we model the BX rating as having no bias relative to I; we effectively absorb any bias into an enlargement of the value s obs .
Get Radiology Tree app to read full this article<
Get Radiology Tree app to read full this article<
sBX=(s2obs−s2/2)−−−−−−−−−−√ s
BX
=
(
s
obs
2
−
s
2
/
2
)
Get Radiology Tree app to read full this article<
Outliers
Get Radiology Tree app to read full this article<
Results
Rater Variability
Get Radiology Tree app to read full this article<
Get Radiology Tree app to read full this article<
Comparison of Manual and Automated Rating
Get Radiology Tree app to read full this article<
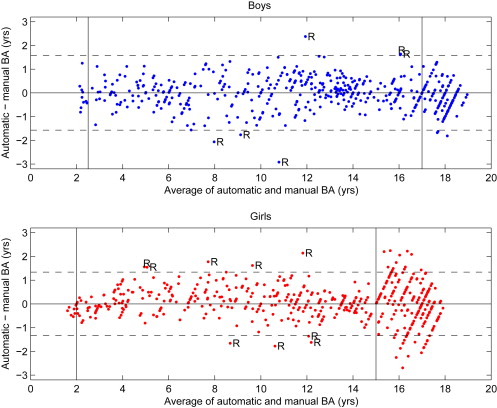
Table 1
The 15 Rerated Images with Large Deviation between the Original Manual (“Manual”) BA (the Average of Two Manual Ratings) and Automated BA
Digital Hand Atlas Identification Ethnicity Gender Age BA BA Differences Cases in which
Automated
BA is Most Accurate Manual Automatic Ref. Manual
Minus Ref. Automated
Minus Ref. 6128 Cau Boy 10.1 10.0 8.2 10.0 0.0 −1.8 4521 Cau Boy 11.5 12.3 9.3 9.1 3.1 0.2 X 3300 Cau Girl 13.7 13.0 11.4 12.1 0.9 −0.7 X 3763 AfrAm Boy 12.4 10.8 13.1 12.2 −1.4 1.0 X 4490 AfrAm Boy 16.9 15.3 16.9 16.8 −1.6 0.0 X 3200 AfrAm Girl 3.8 4.3 5.8 5.9 −1.6 −0.1 X 6002 AfrAm Girl 7.1 6.8 8.6 8.3 −1.4 0.3 X 3208 AfrAm Girl 11.3 10.8 12.9 12.9 −2.1 0.0 X 5135 His Boy 9.3 9.0 6.9 7.4 1.6 −0.4 X 5555 His Boy 13.5 15.3 16.9 16.5 −1.3 0.3 X 5133 His Girl 5.4 4.2 5.7 4.5 −0.3 1.2 6023 His Girl 9.2 8.8 10.5 10.1 −1.3 0.3 X 5763 His Girl 10.6 9.5 7.8 8.2 1.3 −0.4 X 5003 Asi Girl 10.9 11.5 9.7 9.7 1.8 0.0 X 5282 Asi Girl 12.1 12.8 11.4 12.5 0.3 −1.1
BA, bone age; Cau, Caucasian; AfrAm, African American; His, Hispanic; Asi, Asian; Ref, the new, blind rerating (the average of two ratings).
The last column indicates the cases where the reference is closer to the automated BA than to the original manual rating. The images are available online at www.ipilab.org/BAAweb .
Get Radiology Tree app to read full this article<
Analysis of Variance
Get Radiology Tree app to read full this article<
Get Radiology Tree app to read full this article<
Get Radiology Tree app to read full this article<
Table 2
The RMS Error and Bias of the Automated BA Method with Respect to the Manual Rating for the Four Ethnicities
Boys Girls Ethnicity_n_ RMS error (y) Bias (y)n RMS error (y) Bias (y) Caucasian 102 0.66 −0.13 79 0.50 0.06 African American 107 0.67 0.27 83 0.64 0.22 Hispanic 96 0.65 0.01 75 0.58 0.16 Asian 87 0.54 −0.08 79 0.57 0.01 All ethnicities 392 0.64 0.03 316 0.57 0.11
The bias is defined as the average of the automated method minus the manual rating. The bone age range is 2.5–17 years for boys and 2–15 years for girls.
Get Radiology Tree app to read full this article<
BA References
Get Radiology Tree app to read full this article<
Get Radiology Tree app to read full this article<
Get Radiology Tree app to read full this article<
Get Radiology Tree app to read full this article<
Get Radiology Tree app to read full this article<
Discussion
Get Radiology Tree app to read full this article<
Get Radiology Tree app to read full this article<
BA References
Get Radiology Tree app to read full this article<
Get Radiology Tree app to read full this article<
Get Radiology Tree app to read full this article<
Get Radiology Tree app to read full this article<
How to Report and Interpret a BA Determination
Get Radiology Tree app to read full this article<
Get Radiology Tree app to read full this article<
Get Radiology Tree app to read full this article<
Get Radiology Tree app to read full this article<
Get Radiology Tree app to read full this article<
Get Radiology Tree app to read full this article<
Conclusions
Get Radiology Tree app to read full this article<
Get Radiology Tree app to read full this article<
Get Radiology Tree app to read full this article<
Acknowledgment
Get Radiology Tree app to read full this article<
Get Radiology Tree app to read full this article<
References
1. Greulich W.W., Pyle S.I.: Radiographic Atlas of Skeletal Development of the Hand and Wrist.2nd ed.1959.Stanford University PressStanford, CA
2. Bull R.K., Edwards P.D., Kemp P.M., et. al.: Bone age assessment: a large scale comparison of the Greulich and Pyle, and Tanner and Whitehouse (TW2) methods. Arch Dis Childhood 1999; 81: pp. 172-173.
3. Thodberg H.H.: Clinical review: an automated method for determination of bone age. J Clin Endocrinol Metab 2009; 94: pp. 2239-2244.
4. Martin D.D., Deusch D., Schweizer R., et. al.: Clinical application of automated Greulich-Pyle bone age in children with short stature. Pediatr Radiol 2009; 39: pp. 598-607.
5. van Rijn R.R., Lequin M.H., Thodberg H.H.: Automatic determination of Greulich and Pyle bone age in healthy Dutch children. Pediatr Radiol 2009; 39: pp. 591-597.
6. Zhang A., Sayre J.W., Vachon L., et. al.: Racial differences in growth patterns of children assessed on the basis of bone age. Radiology 2009; 250: pp. 228-235.
7. Thodberg H.H., Kreiborg S., Juul A., et. al.: The BoneXpert method for automated determination of skeletal maturity. IEEE Trans Med Imaging 2009; 28: pp. 52-66.
8. Tanner J.M.: A History of the Study of Human Growth.1981.Cambridge University PressCambridge, UK
9. Loder R.T., Estle D.T., Morrison K., et. al.: Applicability of the Greulich and Pyle skeletal age standards to black and white children of today. Arch Pediatr Adolesc Med 1993; 147: pp. 1329.
10. Thodberg H.H., Jenni O.G., Caflisch J., et. al.: Prediction of adult height based on automated determination of bone age. J Clin Endocrinol Metab 2009; 94: pp. 4868-4874.