
Rationale and Objectives
The aim of this study was to validate a projection-domain lesion-insertion method with observer studies.
Materials and Methods
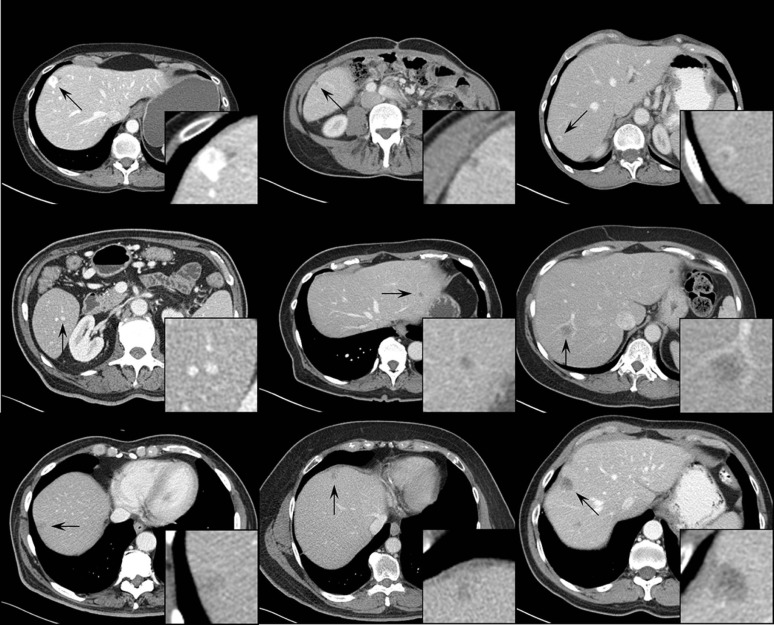
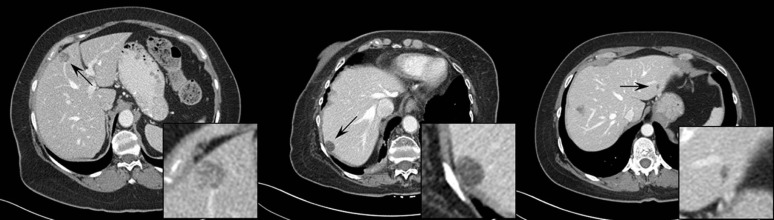
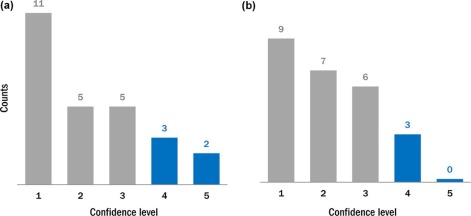
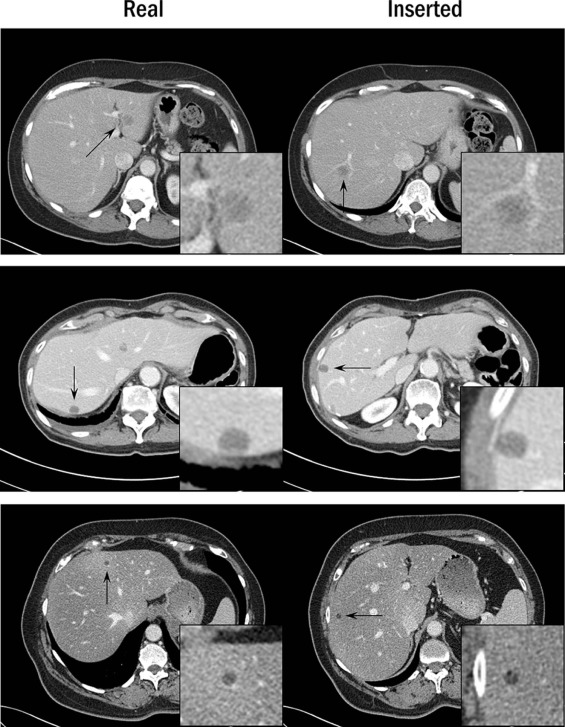
A total of 51 proven liver lesions were segmented from computed tomography images, forward projected, and inserted into patient projection data. The images containing inserted and real lesions were then reconstructed and examined in consensus by two radiologists. First, 102 lesions (51 original, 51 inserted) were viewed in a randomized, blinded fashion and scored from 1 (absolutely inserted) to 10 (absolutely real). Statistical tests were performed to compare the scores for inserted and real lesions. Subsequently, a two-alternative-forced-choice test was conducted, with lesions viewed in pairs (real vs. inserted) in a blinded fashion. The radiologists selected the inserted lesion and provided a confidence level of 1 (no confidence) to 5 (completely certain). The number of lesion pairs that were incorrectly classified was calculated.
Results
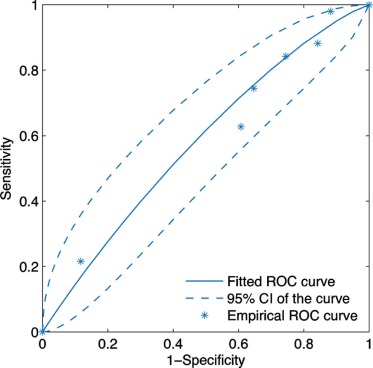
The scores for inserted and proven lesions had the same median (8) and similar interquartile ranges (inserted, 5.5–8; real, 6.5–8). The mean scores were not significantly different between real and inserted lesions ( P value = 0.17). The receiver operating characteristic curve was nearly diagonal, with an area under the curve of 0.58 ± 0.06. For the two-alternative-forced-choice study, the inserted lesions were incorrectly identified in 49% (25 out of 51) of pairs; radiologists were incorrect in 38% (3 out of 8) of pairs even when they felt very confident in identifying the inserted lesion (confidence level ≥4).
Conclusions
Radiologists could not distinguish between inserted and real lesions, thereby validating the lesion-insertion technique, which may be useful for conducting virtual clinical trials to optimize image quality and radiation dose.
Introduction
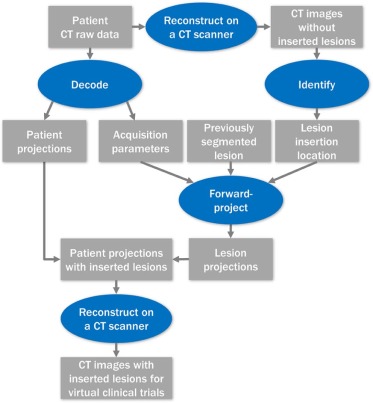
To optimize computed tomography (CT) image quality and radiation dose for liver lesion detection tasks, patient images containing proven liver lesions are required. Proof of lesion presence and etiology may be obtained from biopsy, surgical extirpation, or regression or progression of hepatic disease on cross-sectional imaging in patients with known hepatic malignancy. Although images containing proven liver lesions can be collected via clinical trials, the process is time-consuming and expensive. An alternative to conventional clinical trials is a virtual clinical trial, which acquires images by inserting lesions into patient images at specified locations. With virtual clinical trials, the image data collection process becomes substantially more time-efficient and less costly. Moreover, creating images containing inserted lesions would permit control of lesion characteristics and locations.
The pathway toward a virtual clinical trial in low-dose liver CT would necessitate several milestones, including (1) the ability to insert lesions into designated locations to ensure that lesions obey anatomic boundaries, (2) that inserted and actual proven liver lesions appear indistinguishable to experienced radiologists, and (3) that lesion detection and characterization for the inserted and real lesions are similar over a range of acquisition and reconstruction conditions. A lesion-insertion method has been recently developed , which inserts lesions via the projection domain (ie, before the image reconstruction) and is compatible with a state-of-the-art commercial CT scanner in both axial and helical modes, with various tube potential settings and focal spot movement patterns. The projection-domain insertion method is more sophisticated than conventional image domain (ie, after the image reconstruction) lesion-insertion methods because the resulting inserted lesions reflect the impact of reconstruction method and parameters on lesion appearance, which is critical to the evaluation of lower dose images with iterative reconstruction.
Get Radiology Tree app to read full this article<
Materials and Methods
Projection-domain Lesion-insertion Program
Get Radiology Tree app to read full this article<
Get Radiology Tree app to read full this article<
Get Radiology Tree app to read full this article<
Patient and Lesion Database
Get Radiology Tree app to read full this article<
Get Radiology Tree app to read full this article<
Observer Study 1: Likelihood Scores
Get Radiology Tree app to read full this article<
Observer Study 2: Two-alternative-forced-choice Study
Get Radiology Tree app to read full this article<
Statistical Analysis
Get Radiology Tree app to read full this article<
Get Radiology Tree app to read full this article<
Get Radiology Tree app to read full this article<
Results
Observer Study 1: Likelihood Scores
Get Radiology Tree app to read full this article<
Get Radiology Tree app to read full this article<
Get Radiology Tree app to read full this article<
Get Radiology Tree app to read full this article<
Observer Study 2: Two-alternative-forced-choice Study
Get Radiology Tree app to read full this article<
Get Radiology Tree app to read full this article<
Discussion
Get Radiology Tree app to read full this article<
Get Radiology Tree app to read full this article<
Get Radiology Tree app to read full this article<
Get Radiology Tree app to read full this article<
Get Radiology Tree app to read full this article<
Get Radiology Tree app to read full this article<
Acknowledgement
Get Radiology Tree app to read full this article<
Appendix A
Patient and Lesion Characteristics
Get Radiology Tree app to read full this article<
Table A1
Summary of Patient and Lesion Characteristics. For Lesions that Are Inhomogeneous, Contrast Values Are Provided Separately for the Hypo-attenuating Part and for the Hyper-attenuating Part
Patient Characteristics Lesion Characteristics Patient Number Water-equivalent Diameter
(cm) Diameter
(cm) Contrast
(HU) Type 1 24.6 1.5 −51, 35 Metastasis from leiomyosarcoma 2 31.6 0.6 −95 Cyst 3 29.9 1.0 −30,110 Hemangioma 4 26.8 0.6 −33 Metastasis from carcinoid 5 26.7 1.9 −91, 130 Hemangioma 2.3 −49, 111 Hemangioma 6 35.9 2.2 −51 Metastasis from colon 1.9 −47 Metastasis from colon 7 32.0 1.6 15 Metastasis from rectum 1.7 14 Metastasis from rectum 2.2 31 Metastasis from rectum 8 26.0 0.7 −93 Cyst 9 30.2 1.9 −34 Metastasis from melanoma 0.6 −24 Metastasis from melanoma 10 23.7 1.2 −10, 59 Hemangioma 11 28.0 3.1 −60 Metastasis from colon 12 29.5 0.7 −91 Metastasis from colon 1.3 −96 Metastasis from colon 0.5 −71 Indeterminate 13 29.0 1.1 −132 Cyst 14 28.8 1.5 −24 Metastasis from pancreas 1.3 −41 Metastasis from pancreas 0.7 59 Hemangioma 15 28.7 1.8 −129 Cyst 16 32.2 1.7 −46 Metastasis from melanoma 17 26.2 0.7 −37 Metastasis from pancreas 0.7 −42 Metastasis from pancreas 1.8 −43 Metastasis from pancreas 18 23.8 1.4 −61 Metastasis from rectum 0.5 −67 Metastasis from rectum 19 27.3 1.9 −65 Hemangioma 0.4 −81 Cyst 20 22.6 1.3 −8 Metastasis from carcinoid 1.0 −19 Metastasis from carcinoid 21 30.4 1.4 −29 Metastasis from leiomyosarcoma 22 33.5 1.6 −42 Metastasis from colon 23 23.7 1.2 −99 Metastasis from thyroid 1.0 −68 Metastasis from thyroid 24 32.5 1.8 −18 Metastasis from rectum 1.9 −10 Metastasis from rectum 25 32.2 0.9 −43 Metastasis from pancreatic neuroendocrine 1.1 −50 Metastasis from pancreatic neuroendocrine 26 30.2 1.0 −76 Metastasis from colon 1.1 −78 Metastasis from colon 27 27.2 0.9 −21 Metastasis from ovary 28 35.8 0.7 −65 Cyst 0.5 −69 Cyst 29 29.3 1.4 −56 Metastasis from leiomyosarcoma 2.0 −69 Metastasis from leiomyosarcoma 30 29.9 0.6 −73 Cyst 24.6 1.6 −33 Metastasis from adenoid cystic carcinoma
Get Radiology Tree app to read full this article<
Appendix B
Acquisition and Reconstruction Parameters
Get Radiology Tree app to read full this article<
Table B1
Summary of Acquisition and Reconstruction Parameters. The Reconstruction Kernel is B40f (Filtered Backprojection) for all Reconstructions and Therefore Not Listed in the Table
Patient Number Acquisition Parameters Reconstruction Parameters Tube Voltage (kV) CTDI vol (mGy) Pitch Slice Thickness (mm) Slice Interval (mm) 1 100 7.6 0.8 5 5 2 100 18.4 0.35 2 2 3 100 13.0 0.8 5 5 4 100 11.8 0.8 3 2.5 5 120 11.6 1 3 2 6 120 25.5 0.8 5 5 7 120 16.5 0.8 5 5 8 100 10.0 0.8 5 5 9 100 11.4 0.8 5 5 10 100 7.1 0.6 5 5 11 100 9.9 0.8 5 5 12 120 23.4 0.75 3 2.5 13 100 12.0 0.8 5 5 14 100 16.8 0.6 2 1 15 100 20.1 0.6 2 1 16 120 26.4 0.6 3 2.5 17 100 17.7 0.6 2 1 18 100 5.5 0.8 5 5 19 100 8.4 0.6 5 5 20 100 6.3 0.6 5 5 21 120 16.8 0.7 5 5 22 120 22.5 0.8 3 2.5 23 100 8.0 0.8 5 5 24 120 16.6 0.8 5 5 25 120 29.9 0.35 2 1 26 120 17.5 0.8 5 5 27 120 14.6 0.6 5 5 28 120 24.9 0.6 5 5 29 120 16.8 0.8 5 5 30 120 18.6 0.8 5 5
Get Radiology Tree app to read full this article<
Appendix C
Lesion Realism Assessment Performed by Radiologist Readers
Get Radiology Tree app to read full this article<
Table C1
The Definition of the Likelihood Scores for Lesion Realism
Score Definition 1 100% confidence that the lesion is not real 2 Very doubtful that the lesion is real 3–4 Unlikely that the lesion is real 5–6 Very unsure whether the lesion is real or not 7–8 Likely that the lesion is real 9 Very likely that the lesion is real 10 100% confidence that the lesion is real
Table C2
The Definition of the Confidence Levels for the Choices Made in the 2AFC Test
Confidence Level Definition 1 No confidence in determination 2 Possibly correct 3 Probably correct 4 Likely correct 5 100% confidence in determination
Get Radiology Tree app to read full this article<
References
1. Chen B., Leng S., Yu L., et. al.: Lesion insertion in the projection domain: methods and initial results. Med Phys 2015; 42: pp. 7034-7042.
2. Madsen M.T., Berbaum K.S., Ellingson A.N., et. al.: A new software tool for removing, storing, and adding abnormalities to medical images for perception research studies. Acad Radiol 2006; 13: pp. 305-312.
3. Li X., Samei E., Delong D.M., et. al.: Three-dimensional simulation of lung nodules for paediatric multidetector array CT. Br J Radiol 2009; 82: pp. 401-411.
4. Solomon J., Samei E.: A generic framework to simulate realistic lung, liver and renal pathologies in CT imaging. Phys Med Biol 2014; 59: pp. 6637-6657.
5. Hoe C.L., Samei E., Frush D.P., et. al.: Simulation of liver lesions for pediatric CT. Radiology 2006; 238: pp. 699-705.
6. de Sisternes L., Brankov J.G., Zysk A.M., et. al.: A computational model to generate simulated three-dimensional breast masses. Med Phys 2015; 42: pp. 1098-1118.
7. Karantzavelos K., Shin H.O., Jordens S., et. al.: Development and evaluation of a software tool for the generation of virtual liver lesions in multidetector-row CT datasets. Acad Radiol 2013; 20: pp. 614-620.
8. Siddon R.L.: Fast calculation of the exact radiological path for a three-dimensional CT array. Med Phys 1985; 12: pp. 252-255.
9. Flohr T.G., Stierstorfer K., Ulzheimer S., et. al.: Image reconstruction and image quality evaluation for a 64-slice CT scanner with z-flying focal spot. Med Phys 2005; 32: pp. 2536-2547.
10. Stierstorfer K., Rauscher A., Boese J., et. al.: Weighted FBP—a simple approximate 3D FBP algorithm for multislice spiral CT with good dose usage for arbitrary pitch. Phys Med Biol 2004; 49: pp. 2209.
11. Lapid E., Ulrich R., Rammsayer T.: On estimating the difference limen in duration discrimination tasks: a comparison of the 2AFC and the reminder task. Percept Psychophys 2008; 70: pp. 291-305.
12. Burgess A.E.: Visual perception studies and observer models in medical imaging. Semin Nucl Med 2011; 41: pp. 419-436.
13. Eng J.: ROC analysis: web-based calculator for ROC curves.2014.Johns Hopkins UniversityBaltimore Available at http://www.jrocfit.org Accessed May 11, 2015; updated March 19
14. Metz C., Kronman H.: Statistical significance tests for binormal ROC curves. J Math Psychol 1980; 22: pp. 218-243.
15. Ma C., Chen B., Koo C.W., et al. Proc. SPIE 9783, Medical Imaging 2016: Physics of Medical Imaging, 97835Y (4 April 2016); doi:10.1117/12.2217009.