
Rationale and Objectives
To compare the repeatability and agreement of a semiautomated liver segmentation method with manual segmentation for assessment of total liver volume on CT (computed tomography).
Materials and Methods
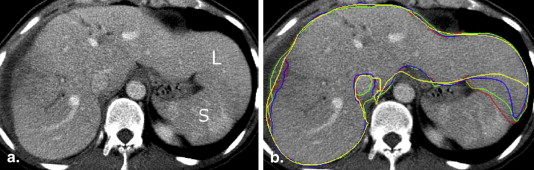
This retrospective, institutional review board–approved study was conducted in 41 subjects who underwent liver CT for preoperative planning. The major pathologies encountered were colorectal cancer metastases, benign liver lesions and hepatocellular carcinoma. This semiautomated segmentation method is based on variational interpolation and 3D minimal path–surface segmentation. Total and subsegmental liver volumes were segmented from contrast-enhanced CT images in venous phase. Two image analysts independently performed semiautomated segmentations and two other image analysts performed manual segmentations. Repeatability and agreement of both methods were evaluated with intraclass correlation coefficients (ICC) and Bland–Altman analysis. Interaction time was recorded for both methods.
Results
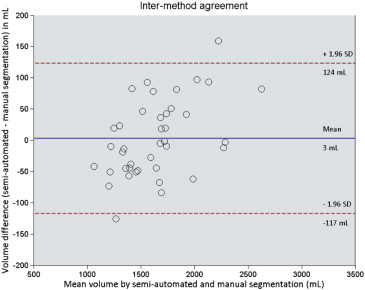
Bland–Altman analysis revealed an intrareader agreement of −1 ± 27 mL (mean ± 1.96 standard deviation) with ICC of 0.999 ( P < .001) for manual segmentation and 12 ± 97 mL with ICC of 0.991 ( P < .001) for semiautomated segmentation. Bland–Altman analysis revealed an interreader agreement of −4 ± 22 mL with ICC of 0.999 ( P < .001) for manual segmentation and 5 ± 98 mL with ICC of 0.991 ( P < .001) for semiautomated segmentation. Intermethod agreement was found to be 3 ± 120 mL with ICC of 0.988 ( P < .001). Mean interaction time was 34.3 ± 16.7 minutes for the manual method and 8.0 ± 1.2 minutes for the semiautomated method ( P < .001).
Conclusions
A semiautomated segmentation method can substantially shorten interaction time while preserving a high repeatability and agreement with manual segmentation.
Assessment of liver volume is a mandatory step before extended hepatectomy for determining the anticipated future liver remnant and before living-donor liver transplantation for selection of appropriate candidates . Liver volumetry requires a multiplanar imaging modality. Computed tomography (CT) is currently the preferred imaging modality for surgical planning because of its superior spatial resolution and short acquisition time . Use of CT in presurgical imaging allows for concomitant assessment of vascular anatomy and quality of liver parenchyma and allows determination of total and lobar volume .
The reference standard method to estimate liver volume involves manually delineating the liver outline, a process called “segmentation,” on consecutive CT images. This method is cumbersome, time-consuming, and impractical for widespread clinical use . Formula-based liver volume estimation using patient height and weight has also been proposed . However, this approach is based on a linear regression equation and is not specific to patient anatomy .
Get Radiology Tree app to read full this article<
Get Radiology Tree app to read full this article<
Get Radiology Tree app to read full this article<
Materials and methods
Get Radiology Tree app to read full this article<
Study Subjects
Get Radiology Tree app to read full this article<
Table 1
Subject Demographics
Characteristic Data Total subjects, N (%) 41 (100) Sex Male (%) 22 (54) Female (%) 19 (46) Age (years) Mean ± standard deviation 55 ± 13 Body mass index in adults (kg/m 2 ) Mean ± standard deviation 26 ± 5 Pathologies Colorectal metastases 27 (66) Benign liver lesions 5 (12) Hepatocellular carcinoma 4 (10) Cholangiocarcinoma 2 (5) Biliary trauma 1 (2) Cystadenocarcinoma 1 (2) Cholangitis 1 (2)
Get Radiology Tree app to read full this article<
CT Imaging Technique
Get Radiology Tree app to read full this article<
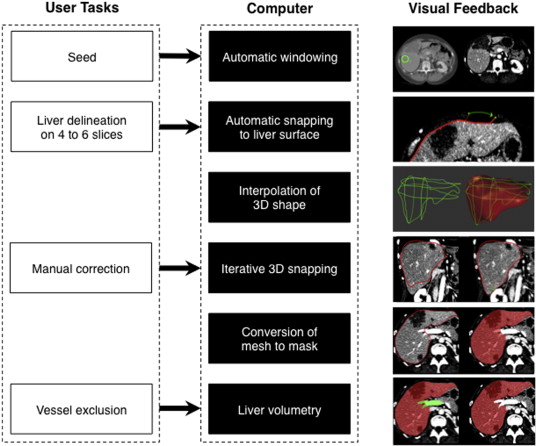
Study Workflow
Get Radiology Tree app to read full this article<
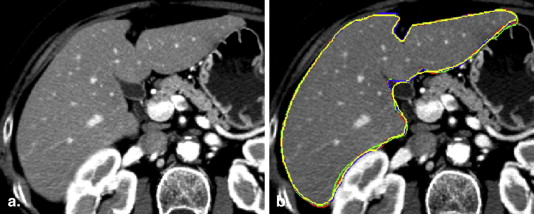
Manual Segmentation
Get Radiology Tree app to read full this article<
Semiautomated Segmentation and Subsegmentation
Get Radiology Tree app to read full this article<
Get Radiology Tree app to read full this article<
Get Radiology Tree app to read full this article<
Get Radiology Tree app to read full this article<
Get Radiology Tree app to read full this article<
Get Radiology Tree app to read full this article<
Get Radiology Tree app to read full this article<
Get Radiology Tree app to read full this article<
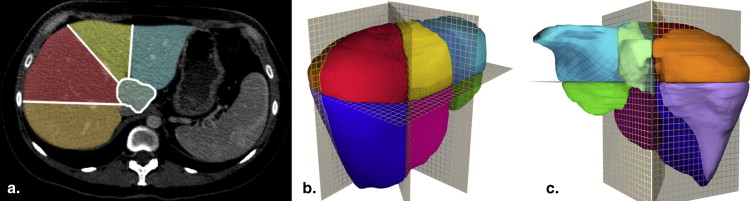
Table 2
Whole and Segmental Liver Volumes by Readers
Reader 1 (Manual) 3 (Semiautomated)P Value ∗ Whole-liver volume (mL) † 1689 ± 478 1688 ± 497 .92 Reader 1 2P Value ∗ Segmental volume (mL) † I 41 ± 16 53 ± 37 .01 II 204 ± 110 186 ± 77 .31 III 97 ± 66 74 ± 57 .05 IVa 186 ± 77 205 ± 83 .18 IVb 84 ± 54 101 ± 87 .10 V 292 ± 99 278 ± 116 .26 VI 221 ± 110 202 ± 114 .14 VII 278 ± 106 292 ± 132 .24 VIII 292 ± 103 306 ± 121 .23
Get Radiology Tree app to read full this article<
Get Radiology Tree app to read full this article<
Get Radiology Tree app to read full this article<
Statistical Analysis
Get Radiology Tree app to read full this article<
Results
Volumes
Get Radiology Tree app to read full this article<
Variability
Get Radiology Tree app to read full this article<
Table 3
Intrareader Repeatability, Interreader and Intermethod Agreement
Comparison Readers ICC Bland–Altman (mL) ∗ Repeatability on whole-liver volume Intrareader manual 1 vs. 1 0.999 −1 ± 27 (−28, 26) 2 vs. 2 1.000 −6 ± 11 (−17, 6) Intrareader semiautomated 3 vs. 3 0.995 −3 ± 67 (−70, 64) 4 vs. 4 0.991 12 ± 97 (−85, 109) Agreement on whole-liver volume Interreader 1 vs. 2 0.999 −4 ± 22 (−27, 18) 3 vs. 4 0.991 5 ± 98 (−93, 103) Intermethod † 1 vs. 3 0.992 −2 ± 93 (−95, 91) 1 vs. 4 0.988 3 ± 120 (−117, 124) Agreement on segmental volumes Interreader Segment I 1 vs. 2 0.585 12 ± 59 (−47, 71) Segment II 1 vs. 2 0.399 −17 ± 207 (−224, 190) Segment III 1 vs. 2 0.331 −23 ± 139 (−162, 116) Segment IVa 1 vs. 2 0.458 18 ± 164 (146, 182) Segment IVb 1 vs. 2 0.713 16 ± 121 (−105, 181) Segment V 1 vs. 2 0.758 −14 ± 150 (−164, 136) Segment VI 1 vs. 2 0.728 −20 ± 162 (−182, 142) Segment VII 1 vs. 2 0.831 14 ± 144 (−130, 158) Segment VIII 1 vs. 2 0.812 14 ± 139 (−125, 153)
ICC, intraclass correlation coefficient; SD, standard deviation.
Get Radiology Tree app to read full this article<
Get Radiology Tree app to read full this article<
Get Radiology Tree app to read full this article<
Repeatability
Get Radiology Tree app to read full this article<
Agreement
Get Radiology Tree app to read full this article<
Get Radiology Tree app to read full this article<
Get Radiology Tree app to read full this article<
Subgroup Analysis in Patients with HCC
Get Radiology Tree app to read full this article<
Error Measures
Get Radiology Tree app to read full this article<
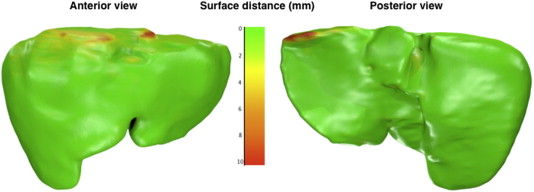
Table 4
Segmentation Performance Measures
Error Measure Ideal Value Intrareader Manual (R1–R1′) ∗ Intrareader Semiautomated (R3–R3′) ∗ Intermethod (R1–R3) Volumetric overlap error (%) 0 † 2.9 ± 0.8 4.4 ± 1.3 6.4 ± 1.4 Average symmetric surface distance (mm) 0 0.4 ± 0.1 0.7 ± 0.3 1.0 ± 0.2 Root mean square symmetric surface distance (mm) 0 0.9 ± 0.2 1.6 ± 0.5 1.8 ± 0.5 Maximum symmetric surface distance (mm) 0 11.8 ± 4.9 17.2 ± 5.2 17.0 ± 5.1
Results reported as mean ± standard deviation.
Get Radiology Tree app to read full this article<
Get Radiology Tree app to read full this article<
Get Radiology Tree app to read full this article<
Time
Get Radiology Tree app to read full this article<
Discussion
Get Radiology Tree app to read full this article<
Get Radiology Tree app to read full this article<
Get Radiology Tree app to read full this article<
Get Radiology Tree app to read full this article<
Get Radiology Tree app to read full this article<
Get Radiology Tree app to read full this article<
Get Radiology Tree app to read full this article<
Get Radiology Tree app to read full this article<
Get Radiology Tree app to read full this article<
Get Radiology Tree app to read full this article<
Get Radiology Tree app to read full this article<
Get Radiology Tree app to read full this article<
Get Radiology Tree app to read full this article<
Get Radiology Tree app to read full this article<
Get Radiology Tree app to read full this article<
Get Radiology Tree app to read full this article<
Get Radiology Tree app to read full this article<
Appendix 1
Segmentation performance measures
Volumetric Overlap Error
Get Radiology Tree app to read full this article<
VOE(A,M)=1−|A∩M||A∪M|×100% VOE
(
A
,
M
)
=
1
−
|
A
∩
M
|
|
A
∪
M
|
×
100
%
Get Radiology Tree app to read full this article<
Get Radiology Tree app to read full this article<
Average Symmetric Surface Distance (ASD)
Get Radiology Tree app to read full this article<
Get Radiology Tree app to read full this article<
ASD(A,M)=1|S(A)|−|S(M)|(∑sA∈S(A)d(sA,S(M))+∑sM∈S(M)d(sM,S(A))) ASD
(
A
,
M
)
=
1
|
S
(
A
)
|
−
|
S
(
M
)
|
(
∑
s
A
∈
S
(
A
)
d
(
s
A
,
S
(
M
)
)
+
∑
s
M
∈
S
(
M
)
d
(
s
M
,
S
(
A
)
)
)
Get Radiology Tree app to read full this article<
Root mean square (RMS) Symmetric Surface Distance
Get Radiology Tree app to read full this article<
RMS(A,M)=1|S(A)|−|S(M)|×(∑sA∈S(A)d2(sA,S(M))+∑sM∈S(M)d2(sM,S(A)))−−−−−−−−−−−−−−−−−−−−−−−−−−−−−−−−−−−−−−−−−−√−−−−−−−−−−−−−−−−−−−−−−−−−−−−−−−−−−−−−−−−−−−−−−−−−−−−−−√ RMS
(
A
,
M
)
=
1
|
S
(
A
)
|
−
|
S
(
M
)
|
×
(
∑
s
A
∈
S
(
A
)
d
2
(
s
A
,
S
(
M
)
)
+
∑
s
M
∈
S
(
M
)
d
2
(
s
M
,
S
(
A
)
)
)
Get Radiology Tree app to read full this article<
Maximum Symmetric Surface Distance (MSD)
Get Radiology Tree app to read full this article<
MSD(A,M)=max{maxsA∈S(A)d(sA,S(M)),maxsM∈S(M)d(sM,S(A))} MSD
(
A
,
M
)
=
max
{
max
s
A
∈
S
(
A
)
d
(
s
A
,
S
(
M
)
)
,
max
s
M
∈
S
(
M
)
d
(
s
M
,
S
(
A
)
)
}
Get Radiology Tree app to read full this article<
Get Radiology Tree app to read full this article<
References
1. Van den Broek M.A., Olde Damink S.W., Dejong C.H., et. al.: Liver failure after partial hepatic resection: definition, pathophysiology, risk factors and treatment. Liver international: official journal of the International Association for the Study of the Liver 2008; 28: pp. 767-780.
2. Luciani A., Rusko L., Baranes L., et. al.: Automated liver volumetry in orthotopic liver transplantation using multiphase acquisitions on MDCT. AJR Am J Roentgenol 2012; 198: pp. W568-W574.
3. Lim M.C., Tan C.H., Cai J., et. al.: CT volumetry of the liver: where does it stand in clinical practice?. Clin Radiol 2014; 69: pp. 887-895.
4. Masutani Y., Uozumi K., Akahane M., et. al.: Liver CT image processing: a short introduction of the technical elements. European journal of radiology 2006; 58: pp. 246-251.
5. Nakayama Y., Li Q., Katsuragawa S., et. al.: Automated hepatic volumetry for living related liver transplantation at multisection CT. Radiology 2006; 240: pp. 743-748.
6. Campadelli P., Casiraghi E., Esposito A.: Liver segmentation from computed tomography scans: a survey and a new algorithm. Artif Intell Med 2009; 45: pp. 185-196.
7. Kamel I.R., Kruskal J.B., Pomfret E.A., et. al.: Impact of multidetector CT on donor selection and surgical planning before living adult right lobe liver transplantation. AJR Am J Roentgenol 2001; 176: pp. 193-200.
8. Pizer S.M., Fletcher P.T., Joshi S., et. al.: A method and software for segmentation of anatomic object ensembles by deformable m-reps. Medical physics 2005; 32: pp. 1335-1345.
9. Suzuki K., Epstein M.L., Kohlbrenner R., et. al.: Quantitative radiology: automated CT liver volumetry compared with interactive volumetry and manual volumetry. AJR Am J Roentgenol 2011; 197: pp. W706-W712.
10. Gao L., Heath D.G., Kuszyk B.S., et. al.: Automatic liver segmentation technique for three-dimensional visualization of CT data. Radiology 1996; 201: pp. 359-364.
11. Vauthey J.-N., Abdalla E.K., Doherty D.A., et. al.: Body surface area and body weight predict total liver volume in Western adults. Liver Transplantation 2002; 8: pp. 233-240.
12. Ribero D., Chun Y.S., Vauthey J.N.: Standardized liver volumetry for portal vein embolization. Seminars in interventional radiology 2008; 25: pp. 104-109.
13. Bae K.T., Giger M.L., Chen C.T., et. al.: Automatic segmentation of liver structure in CT images. Medical physics 1993; 20: pp. 71-78.
14. Hermoye L., Laamari-Azjal I., Cao Z., et. al.: Liver segmentation in living liver transplant donors: comparison of semiautomatic and manual methods. Radiology 2005; 234: pp. 171-178.
15. Massoptier L., Casciaro S.: A new fully automatic and robust algorithm for fast segmentation of liver tissue and tumors from CT scans. European radiology 2008; 18: pp. 1658-1665.
16. Heimann T., van Ginneken B., Styner M.A., et. al.: Comparison and evaluation of methods for liver segmentation from CT datasets. IEEE Trans Med Imaging 2009; 28: pp. 1251-1265.
17. Udupa J.K., Leblanc V.R., Zhuge Y., et. al.: A framework for evaluating image segmentation algorithms. Computerized medical imaging and graphics : the official journal of the Computerized Medical Imaging Society 2006; 30: pp. 75-87.
18. Couinaud C.: Le Foie: études anatomiques et chirurgicales.1957.MassonParis
19. Kass M., Witkin A., Terzopoulos D.: Snakes: active contour models. International Journal of Computer Vision 1988; 1: pp. 321-331.
20. Chav R., Cresson T., Kauffmann C., et. al.: Method for fast and accurate segmentation processing from prior shape: application to femoral head segmentation on x-ray images. Proc of SPIE 2009; 7259: pp. 72594Y-Y-8.
21. Heckel F., Konrad O., Hahn H.K., et. al.: Interactive 3D medical image segmentation with energy-minimizing implicit functions. Computers & Graphics 2010; 35: pp. 275-287.
22. Turk G., O’Brien J.: Modelling with implicit surfaces that interpolate. ACM Transactions on Graphics 2002; 21: pp. 855-873.
23. Praun E., Hoppe H.: Spherical parametrization and remeshing. ACM Transactions on Graphics (TOG) - Proceedings of ACM SIGGRAPH 2003 2003; 22: pp. 340-349.
24. Bland J.M., Altman D.G.: Statistical methods for assessing agreement between two methods of clinical measurement. Lancet 1986; 327: pp. 307-310.
25. Ben-Haim M., Emre S., Fishbein T.M., et. al.: Critical graft size in adult-to-adult living donor liver transplantation: impact of the recipient’s disease. Liver Transpl 2001; 7: pp. 948-953.
26. Abdalla E.K., Adam R., Bilchik A.J., et. al.: Improving resectability of hepatic colorectal metastases: expert consensus statement. Annals of surgical oncology 2006; 13: pp. 1271-1280.
27. Karlo C., Reiner C.S., Stolzmann P., et. al.: CT- and MRI-based volumetry of resected liver specimen: comparison to intraoperative volume and weight measurements and calculation of conversion factors. European journal of radiology 2010; 75: pp. e107-e111.
28. Dawant B.M., Li R., Lennon B., et. al.: Semi-automatic segmentation of the liver and its evaluation on the MICCAI 2007 grand challenge data set. Proc MICCAI Workshop on 3-D Segmentat Clinic: a grand challenge. Berlin, Heidelberg, Germany: Springer-Verlag.2007.pp. 215-221.
29. Lee J., Kim N., Lee H., et. al.: Efficient liver segmentation using a level-set method with optimal detection of the initial liver boundary from level-set speed images. Computer methods and programs in biomedicine 2007; 88: pp. 26-38.
30. Beichel R., Bauer C., Bornik A., et. al.: Liver segmentation in CT data: a segmentation refinement approach. Proc MICCAI Workshop 3-D Segmentat Clinic: a grand challenge. Berlin, Heidelberg, Germany: Springer-Verlag.2007.pp. 235-245.
31. Linguraru M.G., Sandberg J.K., Jones E.C., et. al.: Assessing hepatomegaly: automated volumetric analysis of the liver. Academic radiology 2012; 19: pp. 588-598.
32. Lemke A.J., Brinkmann M.J., Schott T., et. al.: Living donor right liver lobes: preoperative CT volumetric measurement for calculation of intraoperative weight and volume. Radiology 2006; 240: pp. 736-742.
33. Yamanaka J., Saito S., Fujimoto J.: Impact of preoperative planning using virtual segmental volumetry on liver resection for hepatocellular carcinoma. World journal of surgery 2007; 31: pp. 1249-1255.
34. Bauer C., Pock T., Sorantin E., et. al.: Segmentation of interwoven 3D tubular tree structures utilizing shape priors and graph cuts. Med Image Anal 2010; 14: pp. 172-184.
35. Siewert R., Schnapauff D., Denecke T., et. al.: Automatic liver segmentation in contrast-enhanced MRI. Bildverarbeitung für die Medizin. volume 574 of CEUR workshop proceedings. CEUR-WS.org2010.Springer-VerlagBerlin, Heidelberg, Germanypp. 405-409. http://ceur-ws.org/Vol-574/
36. Arya S., Mount D., Netanyahu N., et. al.: An optimal algorithm for approximate nearest neighbour searching. J ACM 1998; 45: pp. 891-923.
37. Huttenlocher D., Klanderman D., Rucklige A.: Comparing images using the Hausdorff distance. IEEE Trans Pattern Anal Mach Intell 1993; 15: pp. 850-863.