
Rationale and Objectives
Positron emission tomography (PET) is actively investigated to aid in target volume definition for radiation therapy. The objectives of this study were to apply an automatic computer algorithm to compute target volumes and to validate the algorithm using histologic data from real human prostate cancer.
Materials and Methods
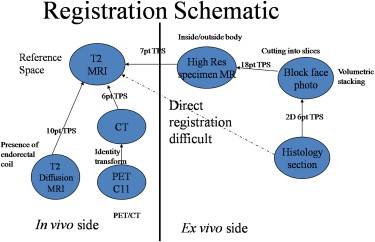
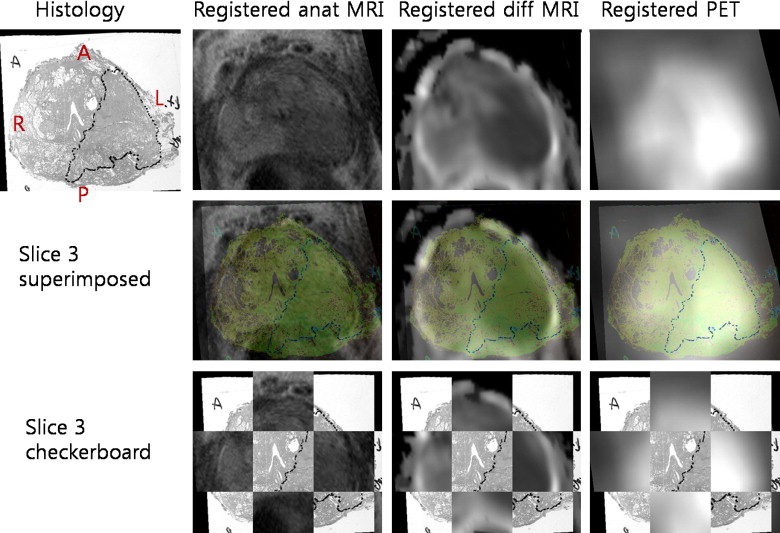
Various modalities for prostate imaging were performed. In vivo imaging included T2 3-T magnetic resonance imaging and 11 C-choline PET. Ex vivo imaging included 3-T magnetic resonance imaging, histology, and block face photos of the prostate specimen. A novel registration method based on mutual information and thin-plate splines was applied to all modalities. Once PET is registered with histology, a voxel-by-voxel comparison between PET and histology is possible. A thresholding technique based on various fractions of the maximum standardized uptake value in the tumor was applied, and the respective computed threshold volume on PET was compared with histologic truth.
Results
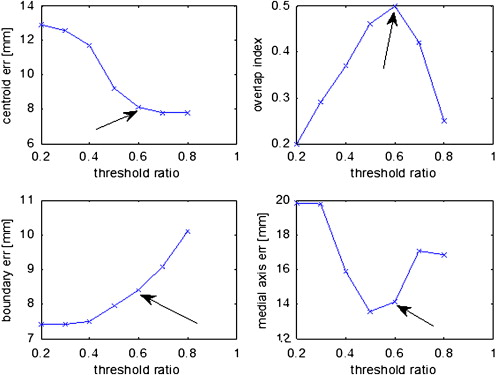
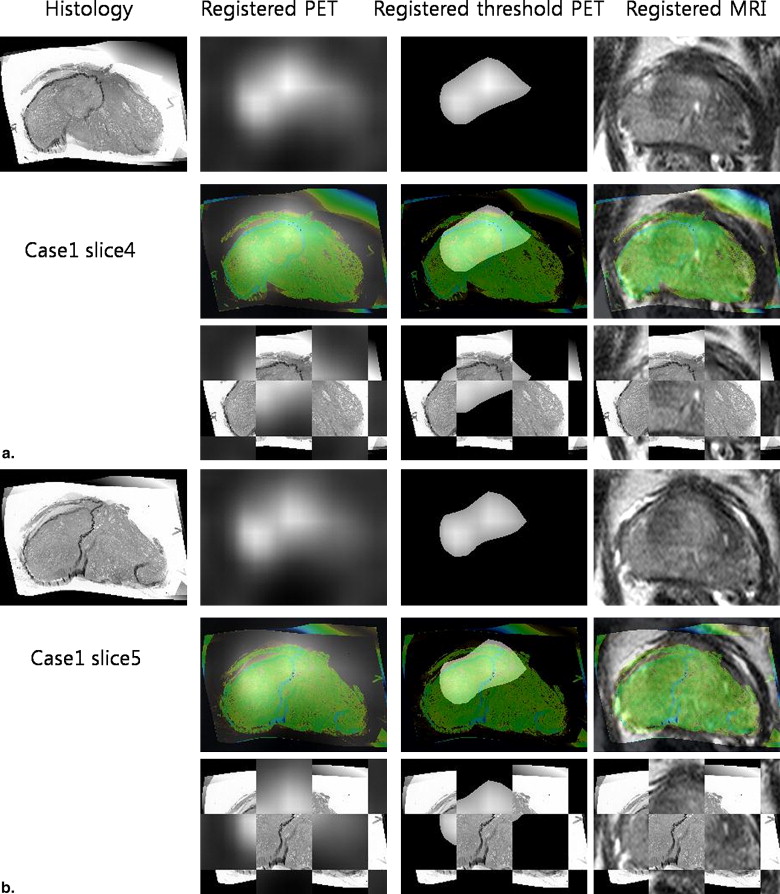
Sixteen patients whose primary tumor volumes ranged from 1.2 to 12.6 cm 3 were tested. PET has low spatial resolution, so only tumors > 4 cm 3 were considered. Four cases met this criterion. A threshold value of 60% of the 11 C-choline maximum standardized uptake value resulted in the highest volume overlap between threshold volume on PET and histology. Medial axis distances between threshold volume on PET and histology showed a mean error of 7.7 ± 5.2 mm.
Conclusions
This is a proof-of-concept study demonstrating for the first time that histology-guided thresholding on PET can delineate tumor volumes in real human prostate cancer.
Substantial technological progress involving intensity-modulated radiotherapy and three-dimensional planning of brachytherapy for prostate cancer has enabled the delivery of radiation treatment with high geometric precision . Radiation oncology refers to the volume, including the entire tumor and its microscopic extensions, as the clinical target volume. The general goal of radiation therapy is to maximize the dose to the target volume while minimizing damage to surrounding normal tissues. With advances in image guidance, accurate target volume definition is becoming even more important, because highly differential radiation doses can only be justified when the planning target volume is precisely matched with the “true” tumor volume.
Currently, target volume definition is based on anatomic imaging with magnetic resonance imaging (MRI) or computed tomography (CT). Although anatomic imaging can convey structural information with high resolution, it suffers from a serious limitation. Anatomic imaging portrays the tumor volume using variation of tissue density (for CT) or relaxation properties (for MRI) using visualized macroanatomic changes and contrast enhancement, which are not necessarily specific tumor characteristics and thus may not accurately differentiate tumor tissue from normal. As a result, the tumor volume is not properly conveyed on anatomic images when visual structural cues related to tumor tissue are lacking.
Get Radiology Tree app to read full this article<
Get Radiology Tree app to read full this article<
Get Radiology Tree app to read full this article<
Materials and methods
Get Radiology Tree app to read full this article<
Get Radiology Tree app to read full this article<
Registration Framework
Get Radiology Tree app to read full this article<
Tˆ=argmaxT∈FMI{A[∙],B[T(∙)]}, T
ˆ
=
arg
max
T
∈
F
MI
{
A
[
•
]
,
B
[
T
(
•
)
]
}
,
where Tˆ T
ˆ is the estimate of the transform, and F is the family of feasible transforms.
Get Radiology Tree app to read full this article<
Get Radiology Tree app to read full this article<
Scan Acquisition
Get Radiology Tree app to read full this article<
Get Radiology Tree app to read full this article<
Get Radiology Tree app to read full this article<
Get Radiology Tree app to read full this article<
Registration Schematic
Get Radiology Tree app to read full this article<
Get Radiology Tree app to read full this article<
Get Radiology Tree app to read full this article<
Get Radiology Tree app to read full this article<
Get Radiology Tree app to read full this article<
Positron Emission Tomographic Thresholding Algorithm
Get Radiology Tree app to read full this article<
Get Radiology Tree app to read full this article<
Get Radiology Tree app to read full this article<
Registration Error
Get Radiology Tree app to read full this article<
Get Radiology Tree app to read full this article<
Results
Get Radiology Tree app to read full this article<
Get Radiology Tree app to read full this article<
Get Radiology Tree app to read full this article<
Get Radiology Tree app to read full this article<
Get Radiology Tree app to read full this article<
Get Radiology Tree app to read full this article<
Table 1
Error Values Between Threshold PET and Histology
Variable Case1 Case2 Case3 Case4 Mean ± SD Independent variables SUVmax threshold on PET (unitless) 0.6 0.6 0.6 0.6 0.6 ± 0.0 Tumor volume (cm 3 ) 12.6 9.9 7.2 6.8 9.1 ± 2.7 Dependent variables Medial axis error (mm) ∗ 14.1 7.3 8.0 1.3 7.7 ± 5.2 Boundary error (mm) ∗ 8.4 17.7 6.2 9.0 10.3 ± 5.1 Centroid error (mm) 8.1 9.0 12.2 6.9 9.1 ± 2.3 Overlap index (unitless) 0.5 0.4 0.1 0.6 0.4 ± 0.2
PET, positron emission tomography; SD, standard deviation; SUVmax, maximum standardized uptake value.
Get Radiology Tree app to read full this article<
Get Radiology Tree app to read full this article<
Discussion
Get Radiology Tree app to read full this article<
Get Radiology Tree app to read full this article<
Get Radiology Tree app to read full this article<
Get Radiology Tree app to read full this article<
Get Radiology Tree app to read full this article<
Get Radiology Tree app to read full this article<
Get Radiology Tree app to read full this article<
Conclusion
Get Radiology Tree app to read full this article<
Get Radiology Tree app to read full this article<
References
1. Grosu A.L., Piert M., Weber W.A., et. al.: Positron emission tomography for radiation treatment planning. Strahlenther Onkol 2005; 181: pp. 483-499.
2. MacManus M., Nestle U., Rosenzweig K.E., et. al.: Use of PET and PET/CT for radiation therapy planning: IAEA expert report 2006-2007. Radiother Oncol 2009; 91: pp. 85-94.
3. Nestle U., Weber W., Hentschel M., et. al.: Biological imaging in radiation therapy: role of positron emission tomography. Phys Med Biol 2009; 54: pp. R1-R25.
4. Ling C.C., Humm J., Larson S., et. al.: Towards multidimensional radiotherapy (MD-CRT): biological imaging and biological conformality. Int J Radiat Oncol Biol Phys 2000; 47: pp. 551-560.
5. Brambilla M., Matheoud R., Secco C., et. al.: Threshold segmentation for PET target volume delineation in radiation treatment planning: the role of target-to-background ratio and target size. Med Phys 2008; 35: pp. 1207-1213.
6. Daisne J.F., Sibomana M., Bol A., et. al.: Tri-dimensional automatic segmentation of PET volumes based on measured source-to-background ratios: influence of reconstruction algorithms. Radiother Oncol 2003; 69: pp. 247-250.
7. Davis J.B., Reiner B., Huser M., et. al.: Assessment of 18F PET signals for automatic target volume definition in radiotherapy treatment planning. Radiother Oncol 2006; 80: pp. 43-50.
8. Yaremko B., Riauka T., Robinson D., et. al.: Threshold modification for tumour imaging in non-small-cell lung cancer using positron emission tomography. Nucl Med Commun 2005; 26: pp. 433-440.
9. Ciernik I.F., Dizendorf E., Baumert B.G., et. al.: Radiation treatment planning with an integrated positron emission and computer tomography (PET/CT): a feasibility study. Int J Radiat Oncol Biol Phys 2003; 57: pp. 853-863.
10. Hara T., Kosaka N., Kishi H.: PET imaging of prostate cancer using carbon-11-choline. J Nucl Med 1998; 39: pp. 990-995.
11. Piert M., Park H., Khan A., et. al.: Detection of aggressive primary prostate cancer with 11C-choline PET/CT using multimodality fusion techniques. J Nucl Med 2009; 50: pp. 1585-1593.
12. Park H., Piert M.R., Khan A., et. al.: Registration methodology for histological sections and in vivo imaging of human prostate. Acad Radiol 2008; 15: pp. 1027-1039.
13. Jacobs M.A., Windham J.P., Soltanian-Zadeh H., et. al.: Registration and warping of magnetic resonance images to histological sections. Med Phys 1999; 26: pp. 1568-1578.
14. Breen M.S., Lancaster T.L., Lazebnik R.S., et. al.: Three-dimensional method for comparing in vivo interventional MR images of thermally ablated tissue with tissue response. J Magn Reson Imaging 2003; 18: pp. 90-102.
15. Hill D.L., Batchelor P.G., Holden M., et. al.: Medical image registration. Phys Med Biol 2001; 46: pp. R1-R45.
16. Meyer C.R., Boes J.L., Kim B., et. al.: Demonstration of accuracy and clinical versatility of mutual information for automatic multimodality image fusion using affine and thin-plate spline warped geometric deformations. Med Image Anal 1997; 1: pp. 195-206.
17. Boostein F.L.: Principal warps: thin-plate splines and the decomposition of deformations. IEEE Trans Pattern Anal Mach Intell 1989; 11: pp. 567-585.
18. Ciernik I.F., Brown D.W., Schmid D., et. al.: 3D-segmentation of the 18F-choline PET signal for target volume definition in radiation therapy of the prostate. Technol Cancer Res Treat 2007; 6: pp. 23-30.
19. Souvatzoglou M., Grosu A.L., Roper B., et. al.: Tumour hypoxia imaging with [(18)F]FAZA PET in head and neck cancer patients: a pilot study. Eur J Nucl Med Mol Imaging 2007; 34: pp. 1566-1575.
20. Sims R., Isambert A., Gregoire V., et. al.: A pre-clinical assessment of an atlas-based automatic segmentation tool for the head and neck. Radiother Oncol 2009; 93: pp. 474-478.
21. Gregoire V., Haustermans K., Geets X., et. al.: PET-based treatment planning in radiotherapy: a new standard?. J Nucl Med 2007; 48: pp. 68S-77S.
22. Soret M., Bacharach S.L., Buvat I.: Partial-volume effect in PET tumor imaging. J Nucl Med 2007; 48: pp. 932-945.
23. Herzog H., Tellmann L., Hocke C., et. al.: NEMA NU2-2001 guided performance evaluation of four Siemens ECAT PET-scanners. Nucl Sci Symp Conf Record 2003; 4: pp. 2836-2838.
24. Aston J.A., Cunningham V.J., Asselin M.C., et. al.: Positron emission tomography partial volume correction: estimation and algorithms. J Cereb Blood Flow Metab 2002; 22: pp. 1019-1034.
25. Grosu A.L., Souvatzoglou M., Roper B., et. al.: Hypoxia imaging with FAZA-PET and theoretical considerations with regard to dose painting for individualization of radiotherapy in patients with head and neck cancer. Int J Radiat Oncol Biol Phys 2007; 69: pp. 541-551.
26. Riedl C.C., Akhurst T., Larson S., et. al.: 18F-FDG PET scanning correlates with tissue markers of poor prognosis and predicts mortality for patients after liver resection for colorectal metastases. J Nucl Med 2007; 48: pp. 771-775.
27. Vansteenkiste J.F., Stroobants S.G., Dupont P.J., et. al., Leuven Lung Cancer Group: Prognostic importance of the standardized uptake value on (18)F-fluoro-2-deoxy-glucose-positron emission tomography scan in non-small-cell lung cancer: an analysis of 125 cases. J Clin Oncol 1999; 17: pp. 3201-3206.
28. Metser U., Even-Sapir E.: Increased (18)F-fluorodeoxyglucose uptake in benign, nonphysiologic lesions found on whole-body positron emission tomography/computed tomography (PET/CT): accumulated data from four years of experience with PET/CT. Semin Nucl Med 2007; 37: pp. 206-222.
29. Piert M., Machulla H.-J., Picchio M., et. al.: Hypoxia-specific tumor imaging with 18 F-Fluoroazomycin arabinoside. J Nucl Med 2005; 46: pp. 106-113.
30. Grosu A.L., Weber W.A., Franz M., et. al.: Reirradiation of recurrent high-grade gliomas using amino acid PET (SPECT)/CT/MRI image fusion to determine gross tumor volume for stereotactic fractionated radiotherapy. Int J Radiat Oncol Biol Phys 2005; 63: pp. 511-519.
31. Buck A.K., Bommer M., Stilgenbauer S., et. al.: Molecular imaging of proliferation in malignant lymphoma. Cancer Res 2006; 66: pp. 11055-11061.
32. Piert M.: Hypoxia imaging.Wahl R.L.Principles and practices of PET and PET/CT.2009.Lippincott, Williams & WilkinsPhiladelphia, PA: