
Rationale and Objectives
Traditional two-class receiver operating characteristic (ROC) analysis is inadequate for the complete evaluation of observer performance in tasks with more than two classes.
Materials and Methods
Here, a Monte Carlo estimation method for operating point coordinates on a three-class ROC surface is developed and compared with analytically calculated coordinates in two special cases: (1) univariate and (2) restricted bivariate trinormal underlying data.
Results
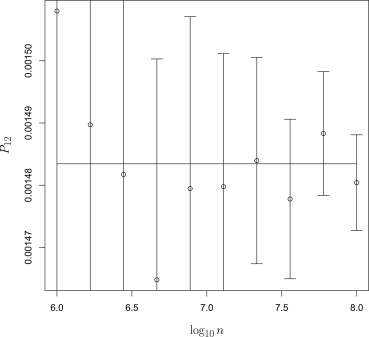
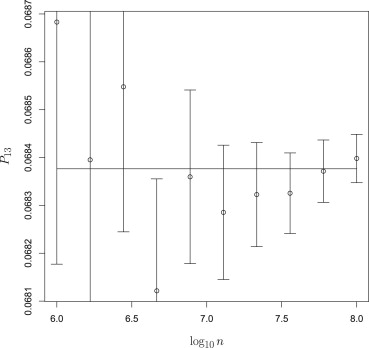
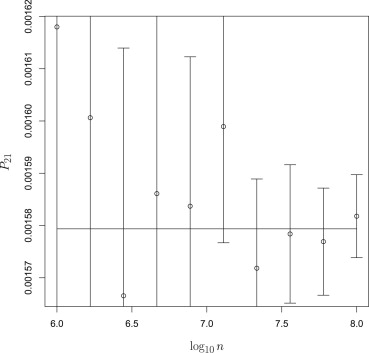
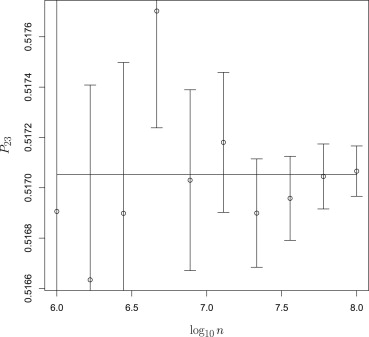
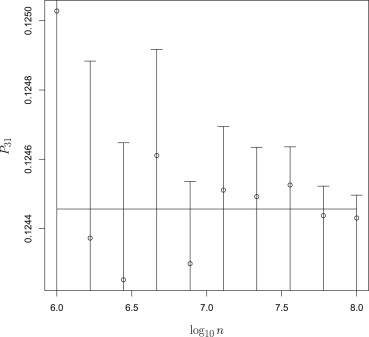
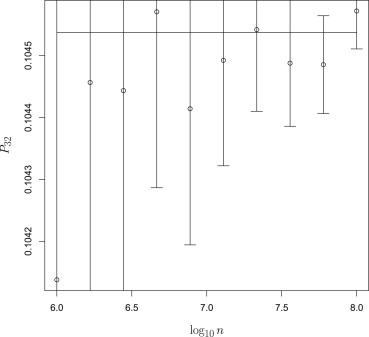
In both cases, the statistical estimates were found to be good in the sense that the analytical values lay within the 95% confidence interval of the estimated values about 95% of the time.
Conclusions
The statistical estimation method should be key in the development of a pragmatic performance metric for evaluation of observers in classification tasks with three or more classes.
Receiver operating characteristic (ROC) analysis has, for many years, been the standard for evaluating observer performance in a medical decision task with two classes to which observations belong . A particularly familiar example is the canonical radiologic task of identifying whether an abnormality, such as a fracture or lesion, is present in an image.
Not all medical, or even radiological, tasks are so readily restricted to two outcomes, however. A particular task might require distinguishing among multiple types of abnormality or distinguishing normal tissue from abnormalities of different types , or, in the computer-aided diagnosis (CAD) task that originally motivated much of the work in this area, one might need to distinguish malignant and benign actual lesions from the false-positive detections produced by an automated scheme . Traditional two-class ROC analysis is inadequate for the complete evaluation of observer performance in such tasks. Unfortunately, although the broader theoretical characteristics of observer behavior in a three-class classification task were outlined many decades ago , the extension of this knowledge to a complete understanding and the implementation of such knowledge into practical tools for addressing real clinical problems have remained elusive.
Get Radiology Tree app to read full this article<
Get Radiology Tree app to read full this article<
Get Radiology Tree app to read full this article<
Get Radiology Tree app to read full this article<
Get Radiology Tree app to read full this article<
Theory
Get Radiology Tree app to read full this article<
Get Radiology Tree app to read full this article<
LR1(x→)≡p(x→∣∣class1)p(x→∣∣class3) LR
1
(
x
→
)
≡
p
(
x
→
|
class
1
)
p
(
x
→
|
class
3
)
LR2(x→)≡p(x→∣∣class2)p(x→∣∣class3) LR
2
(
x
→
)
≡
p
(
x
→
|
class
2
)
p
(
x
→
|
class
3
)
and instead of a simple point boundary between regions where the various classifications are made, we have a set of three intersecting decision boundary line segments
γ121LR1−γ212LR2=γ313−γ323 γ
121
LR
1
−
γ
212
LR
2
=
γ
313
−
γ
323
γ131LR1+(γ232−γ212)LR2=γ313 γ
131
LR
1
+
(
γ
232
−
γ
212
)
LR
2
=
γ
313
(γ131−γ121)LR1+γ232LR2=γ323, (
γ
131
−
γ
121
)
LR
1
+
γ
232
LR
2
=
γ
323
,
which we call, respectively, the “1-vs.-2” boundary, the “1-vs.-3” boundary, and the “2-vs.-3” boundary . The γjij γ
j
i
j are the decision criteria used by the ideal observer, only five of which are independent (Equations 1 through 3 can be multiplied by any number, but the lines described will be left unchanged). For brevity, this collection of values can be written as a vector γ→ γ
→ . The conditional probability of the observer assigning an observation to class i , given that it is actually drawn from class j , is the integral of the PDF of the likelihood ratios (conditional on membership in class j ) over the region where class i is decided; this misclassification probability is denoted by Pij P
i
j , and forms one of the six coordinates of the ROC space .
Get Radiology Tree app to read full this article<
Get Radiology Tree app to read full this article<
p(x|class1)=N(x;μ1,σ21), p
(
x
|
class
1
)
=
N
(
x
;
μ
1
,
σ
1
2
)
,
p(x|class2)=N(x;μ2,σ22), p
(
x
|
class
2
)
=
N
(
x
;
μ
2
,
σ
2
2
)
,
p(x|class3)=N(x;0,1), p
(
x
|
class
3
)
=
N
(
x
;
0
,
1
)
,
where N(x;μ,σ2) N
(
x
;
μ
,
σ
2
) is a normal PDF of x with mean μ and variance σ2 σ
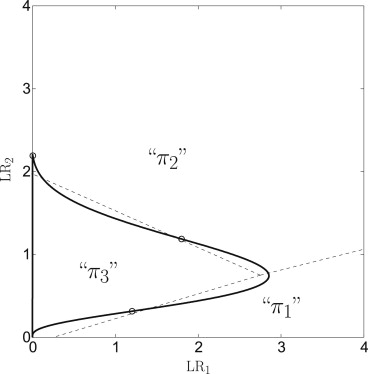
2 . This means LR1 LR
1 and LR2 LR
2 are each functions of the single variable x , and so we can express LR2 LR
2 as a relation of LR1 LR
1 . Using the properties of normal functions, these relations can be “cataloged” and the results used to analytically calculate operating points of the ideal observer given particular values of the decision criteria γ→ γ
→ . An example of such an LR curve for a particular set of data parameters μ and σ2 σ
2 , and decision criteria γ→ γ
→ , is shown in Figure 1 .
Get Radiology Tree app to read full this article<
Get Radiology Tree app to read full this article<
p(x→∣∣class1)=N(x→;μ→1,I), p
(
x
→
|
class
1
)
=
N
(
x
→
;
μ
→
1
,
I
)
,
p(x→∣∣class2)=N(x→;μ→2,I), p
(
x
→
|
class
2
)
=
N
(
x
→
;
μ
→
2
,
I
)
,
p(x→∣∣class3)=N(x→;0→,I), p
(
x
→
|
class
3
)
=
N
(
x
→
;
0
→
,
I
)
,
where I is the 2×2 2
×
2 identity matrix. It can be shown, generalizing the approach of Barrett et al for the two-class case , that
λ1(x→)=x→⋅μ→1−∣∣μ1−→∣∣22 λ
1
(
x
→
)
=
x
→
·
μ
→
1
−
|
μ
1
→
|
2
2
λ2(x→)=x→⋅μ→2−∣∣μ2−→∣∣22 λ
2
(
x
→
)
=
x
→
·
μ
→
2
−
|
μ
2
→
|
2
2
where λi(x→)≡logLRi(x→) λ
i
(
x
→
)
≡
logLR
i
(
x
→
) . From this it follows that the random variables λ1 λ
1 and λ2 λ
2 also follow bivariate normal distributions for each of the three classes.
Get Radiology Tree app to read full this article<
Get Radiology Tree app to read full this article<
Get Radiology Tree app to read full this article<
Materials and methods
Get Radiology Tree app to read full this article<
Get Radiology Tree app to read full this article<
Get Radiology Tree app to read full this article<
Results
Get Radiology Tree app to read full this article<
Get Radiology Tree app to read full this article<
Get Radiology Tree app to read full this article<
Table 1
Univariate Data
fCI(P12) f
C
I
(
P
12
) fCI(P13) f
C
I
(
P
13
) fCI(P21) f
C
I
(
P
21
) fCI(P23) f
C
I
(
P
23
) fCI(P31) f
C
I
(
P
31
) fCI(P32) f
C
I
(
P
32
) 0.96 0.97 0.92 0.99 0.89 0.91
The fraction of all conditions (decision criteria γ→ γ
→ and univariate data parameters β→ β
→ ) for which the analytically calculated operation point coordinate lay within the 95% confidence interval of the estimated operating point.
Table 2
Bivariate Data
fCI(P12) f
C
I
(
P
12
) fCI(P13) f
C
I
(
P
13
) fCI(P21) f
C
I
(
P
21
) fCI(P23) f
C
I
(
P
23
) fCI(P31) f
C
I
(
P
31
) fCI(P32) f
C
I
(
P
32
) 0.94 0.96 0.94 0.93 0.93 0.9
The fraction of all conditions (decision criteria γ→ γ
→ and bivariate data parameters β→ β
→ ) for which the analytically calculated operation point coordinate lay within the 95% confidence interval of the estimated operating point.
Get Radiology Tree app to read full this article<
Discussion
Get Radiology Tree app to read full this article<
Get Radiology Tree app to read full this article<
Get Radiology Tree app to read full this article<
Get Radiology Tree app to read full this article<
Get Radiology Tree app to read full this article<
Conclusion
Get Radiology Tree app to read full this article<
Acknowledgments
Get Radiology Tree app to read full this article<
Get Radiology Tree app to read full this article<
References
1. Metz C.E.: Basic principles of ROC analysis. Semin Nucl Med 1978; VIII: pp. 283-298.
2. Ashizawa K., MacMahon H., Ishida T., et. al.: Effect of an artificial neural network on radiologists’ performance in the differential diagnosis of interstitial lung disease using chest radiographs. AJR Am J Roentgenol 1999; 172: pp. 1311-1315.
3. He X., Song X., Frey E.C.: Application of three-class ROC analysis to task-based image quality assessment of simultaneous dual-isotope myocardial perfusion SPECT (MPS). IEEE Trans Med Imag 2008; 27: pp. 1556-1567.
4. Chan H.-P., Sahiner B., Hadjiiski L.M., et. al.: Design of three-class classifiers in computer-aided diagnosis: Monte Carlo simulation study.Milan Sonka Michael Fitzpatrick J.Proc. SPIE Vol. 5032 Medical Imaging.2003.Image Processing, SPIEBellingham, WA:pp. 567-578.
5. Edwards D.C., Lan L., Metz C.E., et. al.: Estimating three-class ideal observer decision variables for computerized detection and classification of mammographic mass lesions. Med Phys 2004; 31: pp. 81-90.
6. Drukker K., Edwards D.C., Giger M.L., et. al.: Computerized 3-way classification of lesions using breast ultrasound and mammography.IWDM 2004: International Workshop on Digital Mammography.2004.Scientific SecretariatDurham, NC:pp. 540-545.
7. Van Trees H.L.: Detection, estimation and modulation theory: part I.1968.John Wiley & SonsNew York
8. Egan J.P.: Signal detection theory and ROC analysis.1975.Academic PressNew York
9. Metz C.E., Herman B.A., Shen J.-H.: Maximum-likelihood estimation of receiver operating characteristic (ROC) curves from continuously-distributed data. Stat Med 1998; 17: pp. 1033-1053.
10. Metz C.E., Pan X.: ‘Proper’ binormal ROC curves: theory and maximum-likelihood estimation. J Math Psychol 1999; 43: pp. 1-33.
11. Mossman D.: Three-way ROCs. Med Decis Making 1999; 19: pp. 78-89.
12. Dreiseitl S., Ohno-Machado L., Binder M.: Comparing three-class diagnostic tests by three-way ROC analysis. Med Decis Making 2000; 20: pp. 323-331.
13. Nakas C.T., Yiannoutsos C.T.: Ordered multiple-class ROC analysis with continuous measurements. Stat Med 2004; 23: pp. 3437-3449.
14. Li J., Fine J.P.: ROC analysis with multiple classes and multiple tests: methodology and its application in microarray studies. Biostatistics 2008; 9: pp. 566-576.
15. Inácio V., Turkman A.A., Alonzo T.A.: Nonparametric Bayesian estimation of the three-way receiver operating characteristic surface. Biometr J 2011; 53: pp. 1011-1024.
16. Papoulis A.: Probability, random variables, and stochastic processes.1991.McGraw-Hill, Inc.New York
17. Scurfield B.K.: Generalization of the theory of signal detectability to n -event m -dimensional forced-choice tasks. J Math Psychol 1998; 42: pp. 5-31.
18. He X., Metz C.E., Tsui B.M.W., et. al.: Three-class ROC analysis—A decision theoretic approach under the ideal observer framework. IEEE Trans Med Imag 2006; 25: pp. 571-581.
19. He X., Frey E.C.: Three-class ROC analysis—the equal error utility assumption and the optimality of three-class ROC surface using the ideal observer. IEEE Trans Med Imag 2006; 25: pp. 979-986.
20. Sahiner B., Chan H.-P., Hadjiiski L.M.: Performance analysis of three-class classifiers: properties of a 3-D ROC surface and the normalized volume under the surface for the ideal observer. IEEE Trans Med Imag 2008; 27: pp. 215-227.
21. He X., Gallas B.D., Frey E.C.: Three-class ROC analysis—toward a general decision theoretic solution. IEEE Trans Med Imag 2010; 29: pp. 206-215. PMCID: PMC2821068
22. Edwards D.C., Metz C.E.: Analysis of proposed three-class classification decision rules in terms of the ideal observer decision rule. J Math Psychol 2006; 50: pp. 478-487.
23. Edwards D.C., Metz C.E.: Optimization of restricted ROC surfaces in three-class classification tasks. IEEE Trans Med Imag 2007; 26: pp. 1345-1356.
24. Edwards D.C., Metz C.E.: Restrictions on the three-class ideal observer’s decision boundary lines. IEEE Trans Med Imag 2005; 24: pp. 1566-1573.
25. Edwards D.C., Metz C.E., Nishikawa R.M.: The hypervolume under the ROC hypersurface of ‘near-guessing’ and ‘near-perfect’ observers in N -class classification tasks,. IEEE Trans Med Imag 2005; 24: pp. 293-299.
26. Edwards D.C., Metz C.E.: A utility-based performance metric for ROC analysis of N-class classification tasks.Yulei Jiang Berkman Sahiner Proc. SPIE Vol. 6515 Medical Imaging.2007.Image Perception, Observer Performance, and Technology Assessment, SPIEBellingham, WA:pp. 6515031-65150310.
27. Edwards D.C., Metz C.E.: The three-class ideal observer for univariate normal data: decision variable and ROC surface properties,. J Math Psychol 2012; 56: pp. 256-273.
28. Edwards D.C., Metz C.E., Kupinski M.A.: Ideal observers and optimal ROC hypersurfaces in N -class classification. IEEE Trans Med Imag 2004; 23: pp. 891-895.
29. Edwards D.C.: Support of the decision variable densities of the three-class ideal observer for bivariate trinormal data.Manning D.J.Abbey C.K.Proc. SPIE Vol. 7966 Medical Imaging.2011.Image Perception, Observer Performance, and Technology Assessment, SPIEBellingham, WA: pp. 79660I1–79660I10
30. Barrett H.H., Abbey C.K., Clarkson E.: Objective assessment of image quality. III. ROC metrics, ideal observers, and likelihood-generating functions. J Opt Soc Am A 1998; 15: pp. 1520-1535.
31. Metz C.E.: Quantification of failure to demonstrate statistical significance: the usefulness of confidence intervals. Invest Radiol 1993; 28: pp. 59-63.
32. Edwards D.C., Metz C.E.: Optimality of a utility-based performance metric for ROC analysis.Sahiner B.Manning D.J.Proc. SPIE Vol. 6917 Medical Imaging.2008.Image Perception, Observer Performance, and Technology Assessment, SPIEBellingham, WA: pp. 69170F1–69170F6