
Rationale and Objectives
Magnetic resonance angiography (MRA) is a well-established modality for the assessment of renal artery stenosis. Using dedicated quantitative analyses, MRA can become a useful tool for assessing renal artery dimensions in patients referred for renal sympathetic denervation (RDN) and for providing accurate measurements of vascular response after RDN. The purpose of this study was to test the reproducibility of a novel MRA quantitative imaging tool and to validate these measurements against intravascular ultrasound (IVUS).
Materials and Methods
In nine patients referred for renal denervation, renal artery dimensions were measured. Bland–Altman analysis was used to assess the intraobserver and interobserver reproducibility.
Results
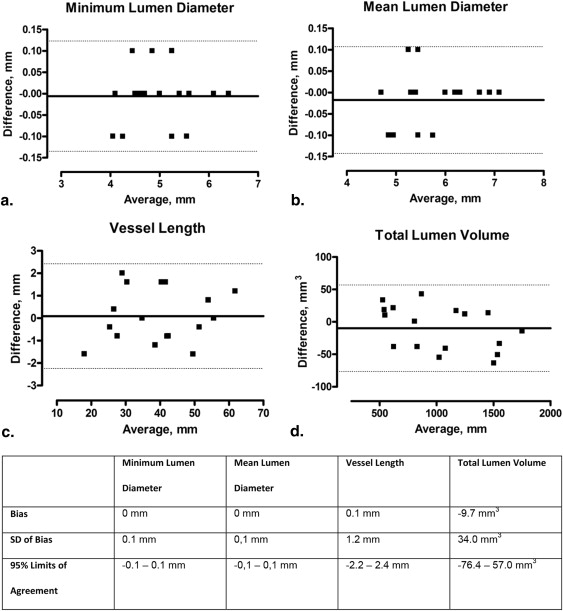
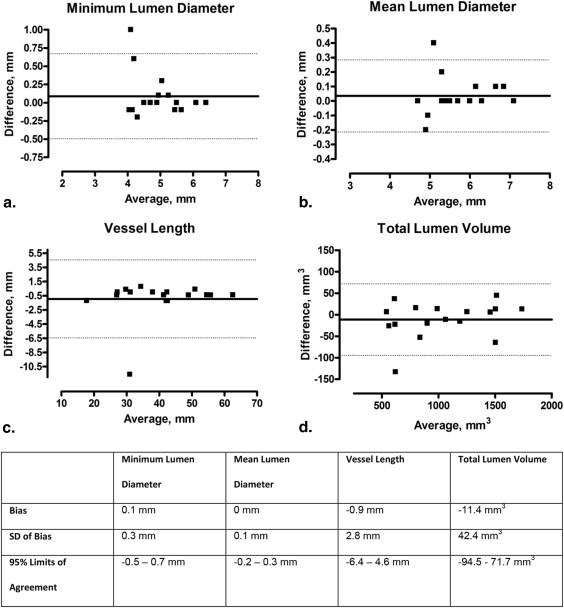
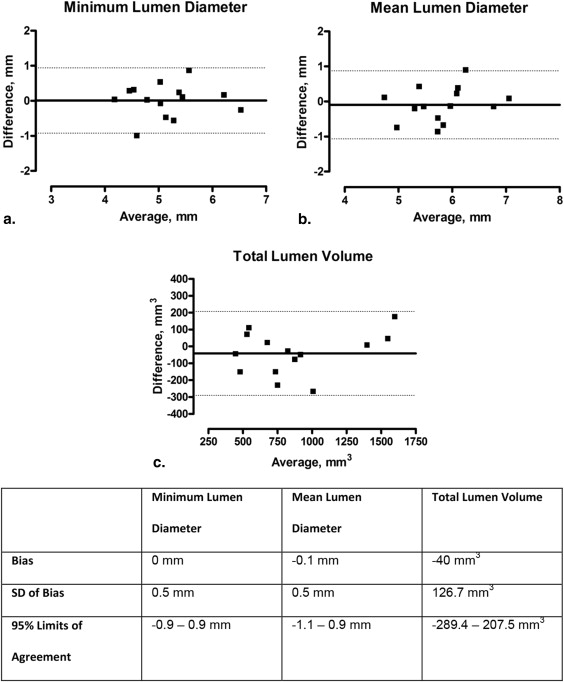
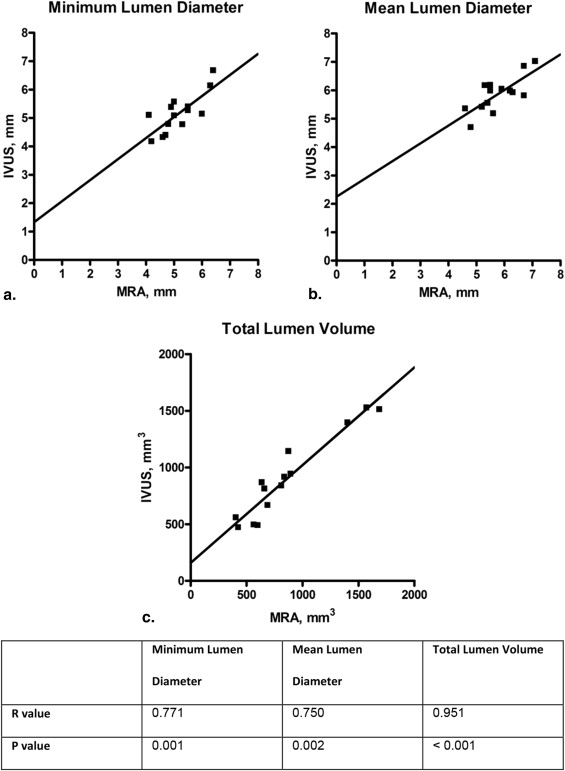
Mean lumen diameter was 5.8 ± 0.7 mm, with a very good intraobserver and interobserver variability of 0.7% (reproducibility: bias, 0 mm; standard deviation [SD], 0.1 mm) and 1.2% (bias, 0 mm; SD, 0.1 mm), respectively. Mean total lumen volume was 1035.3 ± 403.6 mm 3 with good intraobserver and interobserver variability of 2.9% (bias, −9.7 mm 3 ; SD, 34.0 mm 3 ) and 2.8% (bias, −11.4 mm 3 ; SD, 42.4 mm 3 ). The correlation (Pearson R ) between mean lumen diameter measured with MRA and IVUS was 0.750 ( P = .002).
Conclusions
Using a novel MRA quantitative imaging tool, renal artery dimensions can be measured with good reproducibility and accuracy. MRA-derived diameters and volumes correlated well with IVUS measurements.
Percutaneous renal sympathetic denervation (RDN) is currently being studied as a potential treatment to lower sympathetic nerve activity in a broad spectrum of diseases . At present, more than 53 devices are available to disrupt renal afferent and efferent nerves traveling along the renal arterial wall. Besides the fact that initial promising, but noncontrolled studies on clinical efficacy in patients with therapy-resistant hypertension were recently challenged by a negative randomized controlled trial, data on long-term safety are mainly limited to the use of the first-generation radiofrequency devices . The currently available data on the incidence of renal artery stenosis, mostly derived from duplex ultrasound findings, are showing a low rate of adverse events, both at short and longer term follow-up . Published data from computed tomography angiography (CTA) or magnetic resonance angiography (MRA) report only binary outcomes , precluding firm conclusion on the true vascular response to RDN itself. As new renal denervation systems are being introduced, there is a need for dedicated volumetric noninvasive imaging tools to accurately assess renal artery integrity at the medium to long term . Furthermore, balloon-based RDN devices require accurate sizing to avoid complications due to oversizing . The aim of the present study was to evaluate a new software tool allowing automated vessel segmentation for quantitative renal artery lumen dimension assessment. Intraobserver and interobserver reproducibility were studied, and MRA-derived measurements were validated with intravascular ultrasound (IVUS).
Materials and methods
Patient Selection
Nine consecutive patients underwent both MRA and preprocedural IVUS at the time of the renal denervation procedure. Because of an early trifurcation in the vessel in one patient, automated segmentation with MRA was not successful in one artery. For the MRA analyses, 17 vessels were used. For the correlation analyses between MRA and IVUS, MRA vessel length was determined and manually adjusted on the basis of the length of the IVUS pullback with either the ostium or bifurcation as landmark. Because of a lack of IVUS measurement in 1 vessel and a lack of visualization of either bifurcation or ostium, a total of 16 arteries in which both MRA and IVUS data were available were used for validation of MRA against IVUS measurements. The study was approved by the hospital ethics committee and conforms to the declaration of Helsinki. All patients provided written informed consent before inclusion.
Magnetic Resonance Angiography Acquisition
Get Radiology Tree app to read full this article<
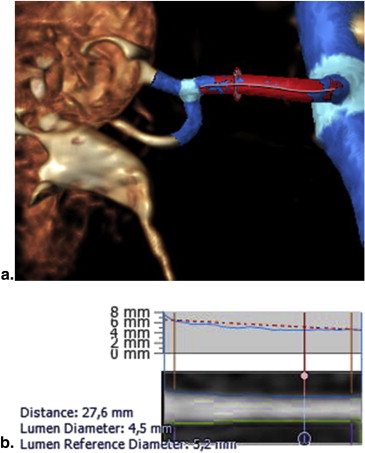
MRA Analysis
Get Radiology Tree app to read full this article<
Get Radiology Tree app to read full this article<
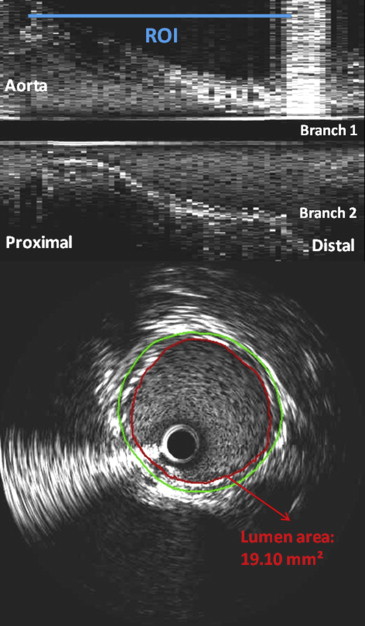
IVUS Acquisition
Get Radiology Tree app to read full this article<
IVUS Analysis
Get Radiology Tree app to read full this article<
Get Radiology Tree app to read full this article<
Statistical Analysis
Get Radiology Tree app to read full this article<
Results
Segmentation Algorithm and Renal Artery Dimensions
Get Radiology Tree app to read full this article<
Table 1
Renal Artery Dimensions After Adjustments with IVUS References
Parameter MRA, Mean ± SD; n = 14 MRA Range IVUS, Mean ± SD; n = 14 IVUS Range_P_ Value Minimum lumen diameter (mm) 5.2 ± 0.7 4.1–6.4 5.2 ± 0.7 4.2–6.7 .947 Mean lumen diameter (mm) 5.8 ± 0.7 4.6–7.1 5.9 ± 0.6 4.7–7.0 .485 Total lumen volume (mm 3 ) 861.9 ± 407.3 406.20–1687.2 902.9 ± 369.4 471.3–1527.5 .248
IVUS, intravascular ultrasound; MRA, magnetic resonance angiography; SD, standard deviation.
A paired t test is used to test differences between the mean values for MRA and IVUS.
Get Radiology Tree app to read full this article<
Intraobserver Reproducibility MRA
Get Radiology Tree app to read full this article<
Get Radiology Tree app to read full this article<
Interobserver Reproducibility MRA
Get Radiology Tree app to read full this article<
Get Radiology Tree app to read full this article<
Validation of MRA Dimensions Against IVUS
Get Radiology Tree app to read full this article<
Get Radiology Tree app to read full this article<
Discussion
Get Radiology Tree app to read full this article<
MRA Technique
Get Radiology Tree app to read full this article<
Validation with IVUS
Get Radiology Tree app to read full this article<
Clinical Applicability
Get Radiology Tree app to read full this article<
Get Radiology Tree app to read full this article<
Get Radiology Tree app to read full this article<
Get Radiology Tree app to read full this article<
Get Radiology Tree app to read full this article<
Limitations
Get Radiology Tree app to read full this article<
Get Radiology Tree app to read full this article<
Conclusions
Get Radiology Tree app to read full this article<
Acknowledgments
Get Radiology Tree app to read full this article<
Supplementary Data
Get Radiology Tree app to read full this article<
Supplementary Tables 1 and 2
Get Radiology Tree app to read full this article<
Get Radiology Tree app to read full this article<
References
1. Bohm M., Linz D., Ukena C., et. al.: Renal denervation for the treatment of cardiovascular high risk-hypertension or beyond?. Circ Res 2014; 115: pp. 400-409.
2. Daemen J., Mahfoud F.: Renal denervation: expanding the indication. Eurointervention 2013; 9: pp. R101-R104.
3. Davis M.I., Filion K.B., Zhang D., et. al.: Effectiveness of renal denervation therapy for resistant hypertension: a systematic review and meta-analysis. J Am Coll Cardiol 2013; 62: pp. 231-241.
4. Bhatt D.L., Kandzari D.E., O’Neill W.W., et. al.: A controlled trial of renal denervation for resistant hypertension. N Engl J Med 2014; 370: pp. 1393-1401.
5. Symplicity H.T.N.I., Esler M.D., Krum H., et. al.: Renal sympathetic denervation in patients with treatment-resistant hypertension (The Symplicity HTN-2 Trial): a randomised controlled trial. Lancet 2010; 376: pp. 1903-1909.
6. Krum H., Schlaich M.P., Sobotka P.A., et. al.: Percutaneous renal denervation in patients with treatment-resistant hypertension: final 3-year report of the Symplicity HTN-1 study. Lancet 2014; 383: pp. 622-629.
7. Papademetriou V., Tsioufis C.P., Sinhal A., et. al.: Catheter-based renal denervation for resistant hypertension: 12-month results of the EnligHTN I First-in-Human Study using a multielectrode ablation system. Hypertension 2014; 64: pp. 565-572.
8. Karanasos A., Van Mieghem N.M., Regar E., et. al.: Serial imaging observations of vascular healing in a denervation-induced renal artery dissection. Eur Heart J 2015; 36: pp. 1040.
9. Antonis Karanasos, Nicolas Van Mieghem, Jurgen Ligthart, Elco van der Heiden, Evelyn Regar, Joost Daemen, editor. Multi-modality intra-arterial imaging assessment of the vascular trauma induced by four different catheter-based renal sympathetic denervation systems. Circ Cardiovasc Interv (in press).
10. Delingette: General object reconstruction based on simplex meshes. Int J Comput. Vision 1999; 32: pp. 111-142.
11. Antiga L., Steinman D.A.: Robust and objective decomposition and mapping of bifurcating vessels. IEEE Trans Med Imaging 2004; 23: pp. 704-713.
12. Girasis C., Schuurbiers J.C., Muramatsu T., et. al.: Advanced three-dimensional quantitative coronary angiographic assessment of bifurcation lesions: methodology and phantom validation. Eurointervention 2013; 8: pp. 1451-1460.
13. van ‘t Klooster R., de Koning P.J., Dehnavi R.A., et. al.: Automatic lumen and outer wall segmentation of the carotid artery using deformable three-dimensional models in MR angiography and vessel wall images. J Magn Reson Imaging 2012; 35: pp. 156-165.
14. White J.H., Bartlett E.S., Bharatha A., et. al.: Reproducibility of semi-automated measurement of carotid stenosis on CTA. Can J Neurol Sci 2010; 37: pp. 498-503.
15. Ahmed S., Zimmerman S.L., Johnson P.T., et. al.: MDCT interpretation of the ascending aorta with semiautomated measurement software: improved reproducibility compared with manual techniques. J Cardiovasc Comput Tomogr 2014; 8: pp. 108-114.
16. Lao D., Parasher P.S., Cho K.C., et. al.: Atherosclerotic renal artery stenosis—diagnosis and treatment. Mayo Clin Proc 2011; 86: pp. 649-657.
17. Schoenberg S.O., Rieger J., Weber C.H., et. al.: High-spatial-resolution MR angiography of renal arteries with integrated parallel acquisitions: comparison with digital subtraction angiography and US. Radiology 2005; 235: pp. 687-698.
18. Vasbinder G.B., Nelemans P.J., Kessels A.G., et. al.: Accuracy of computed tomographic angiography and magnetic resonance angiography for diagnosing renal artery stenosis. Ann Intern Med 2004; 141: pp. 674-682. discussion 82
19. Leiner T., de Haan M.W., Nelemans P.J., et. al.: Contemporary imaging techniques for the diagnosis of renal artery stenosis. Eur Radiol 2005; 15: pp. 2219-2229.
20. Heverhagen J.T., Wright C.L., Schmalbrock P., et. al.: Dose comparison of single versus double dose in contrast-enhanced magnetic resonance angiography of the renal arteries: intra-individual cross-over blinded trial using Gd-DTPA. Eur Radiol 2009; 19: pp. 67-72.
21. Zhang H.L., Sos T.A., Winchester P.A., et. al.: Renal artery stenosis: imaging options, pitfalls, and concerns. Prog Cardiovasc Dis 2009; 52: pp. 209-219.
22. Eklof H., Ahlstrom H., Magnusson A., et. al.: A prospective comparison of duplex ultrasonography, captopril renography, MRA, and CTA in assessing renal artery stenosis. Acta Radiol 2006; 47: pp. 764-774.
23. Kaltenbach B., Id D., Franke J.C., et. al.: Renal artery stenosis after renal sympathetic denervation. J Am Coll Cardiol 2012; 60: pp. 2694-2695.
24. Jaen Aguila F., Mediavilla Garcia J.D., Molina Navarro E., et. al.: Bilateral renal artery stenosis after renal denervation. Hypertension 2014; 63: pp. e126-e127.
25. Pucci G., Battista F., Lazzari L., et. al.: Progression of renal artery stenosis after renal denervation. Impact on 24-hour blood pressure. Circ J 2014; 78: pp. 767-768.