
Rationale and Objectives
Computed tomography (CT) airways measurements can be used as surrogates to spirometric measurements for assessing bronchodilation in a particular patient with chronic obstructive pulmonary disease. Although spirometric measurements show variations within the opening hours of a hospital department, we aimed to compare the variability of CT airways measurements between morning and afternoon in patients with chronic obstructive pulmonary disease to that of spirometric measurements.
Materials and Methods
Twenty patients had pulmonary function tests and CT around 8 am and 4 pm . Luminal area (LA) and wall thickness (WT) of third and fourth generation airways were measured twice by three readers. The percentage of airway area occupied by the wall (WA%) and the square root of wall area at an internal perimeter of 10 mm (√WAPi10) were calculated. The effects of examination time, reader, and measurement session on CT airways measurements were assessed, and the variability of these measurements was compared to that of spirometric measurements.
Results
Variability of LA 3rd and LA 4th was greater than that of spirometric measurements ( P values ranging from <.001 to .033). There was no examination time effect on √WAPi10, WT 3rd , LA 4th , or WA% 4th ( P values ranging from .102 to .712). There was a reader effect on all CT airways measurements ( P values ranging from <.001 to .028), except in WT 3rd ( P > .999). There was no effect of measurement session on any CT airway measurement ( P values ranging from .535 to >.999).
Conclusion
As the variability of LA 3rd and LA 4th is greater than that of spirometric measurements, clinical studies should include cohorts with larger numbers of patients when considering LA than when considering spirometric measurements as end points.
Introduction
Chronic obstructive pulmonary disease (COPD) is a heterogeneous disease characterized by a persistent airflow limitation measured by spirometry . The major determinants of this limitation are pulmonary emphysema and airways disease, each of which coexists at various degrees in any given patient. The differences in degrees and varying relationships between determinants have suggested the need for phenotyping COPD . Computed tomography (CT)—through objective quantification of pulmonary emphysema and airways disease—could help in achieving clinically meaningful phenotyping . Although CT quantification of pulmonary emphysema has been extensively addressed , some studies have reported that airways disease could also be quantified at CT through several measurements obtained in proximal airways that are correlated to histologic measurements of distal airways : the wall thickness (WT); the luminal area (LA); the percentage of airway area occupied by the wall (WA%); and the square root of wall area at an internal perimeter of 10 mm (√WAPi10). Moreover, recent studies suggested that some of these CT airways measurements could be used as surrogate to spirometric measurements for assessing bronchodilation in a particular patient with COPD . Nevertheless, although spirometric measurements may show variations within the opening hours of a hospital department, the variability of the CT airways measurements as compared to that of spirometric measurements remains unknown . This knowledge could be of importance in the perspective of using CT airways measurements as end points instead of spirometric measurements . The purpose of our study was therefore to compare the variability of CT airways measurements between morning and afternoon in patients with COPD with that of spirometric measurements.
Materials and Methods
Subjects
Twenty consecutive ambulatory patients were recruited from the COPD clinic of our institution. This group comprised 14 men and 4 women who fulfilled the Global Initiative for Chronic Obstructive Lung Disease (GOLD) criteria , including ≥40 years of age, smoking history of 10 pack-years or more, and a post-bronchodilator forced expiratory volume in one second to forced vital capacity ratio (FEV 1 /FVC) less than 0.7. These patients also fulfilled the following criteria: no COPD exacerbation or respiratory infection in the 4 weeks before the study; no concomitant pulmonary disease (eg, tuberculosis, bronchiectasis); no pulmonary resection; and no active malignancy or malignancy of any organ within the past 5 years. Age was 64 ± 11 years (mean ± standard deviation). COPD was graded as GOLD I in two patients, as GOLD II in 13 patients, as GOLD III in four patients, and as GOLD IV in one patient . Mean smoking history was 36 pack-years ± 13. On the same day, the patients performed twice pulmonary function tests (PFT) and chest CT scans: the first ones in the morning (around 8 am ) and the second ones in the afternoon (around 4 pm ). This schedule was arbitrarily chosen to cover the opening hours of an imaging department. Treatments in our 20 patients were short-acting β2-agonists (two patients), long-acting anticholinergics (six patients), combination of short-acting β2-agonists plus anticholinergics (eight patients), and combination of long-acting β2-agonists plus corticosteroids (four patients).
Pulmonary Function Tests
Get Radiology Tree app to read full this article<
CT Scans
Get Radiology Tree app to read full this article<
CT Airways Measurements
Get Radiology Tree app to read full this article<
Statistical Analyses
Get Radiology Tree app to read full this article<
Get Radiology Tree app to read full this article<
Get Radiology Tree app to read full this article<
Get Radiology Tree app to read full this article<
Results
PFT Results
Get Radiology Tree app to read full this article<
TABLE 1
Comparisons of Pulmonary Function Tests Between Morning and Afternoon
Morning Afternoon_P_ Values FEV 1 (L) 1.68 ± 0.68 1.68 ± 0.66 .827 FEV 1 (% predicted) 56.8 ± 19.0 56.9 ± 18.1 .879 FVC (L) 3.01 ± 0.95 3.02 ± 0.94 .913 FVC (% predicted) 81.5 ± 18.2 81.0 ± 15.0 .741 FEV 1 /FVC (%) 53.93 ± 11.11 53.66 ± 10.67 .973 FEV 1 /FVC (% predicted) 70.2 ± 14.6 69.7 ± 13.4 .913 FRC (L) 5.24 ± 1.11 5.09 ± 1.00 .341 FRC (% predicted) 162.8 ± 39.9 156.9 ± 31.2 .225 TLC (L) 7.57 ± 1.20 7.37 ± 1.30 .106 TLC (% predicted) 120.5 ± 11.4 117 ± 12.5 .080 RV (L) 4.54 ± 0.95 4.11 ± 0.88 .082 RV (% predicted) 203.4 ± 43.8 182.9 ± 36 .061 RV/TLC (%) 60.21 ± 8.61 56.74 ± 8.30 .120 DLCO (mL/min/mm Hg) 14.12 ± 6.19 14.49 ± 6.32 .666 DLCO (% predicted) 52.7 ± 19.8 54.1 ± 19.9 .737 DLCO/VA (mL/min/mm Hg/L) 2.44 ± 0.83 2.71 ± 0.84 .185 DLCO/VA (% predicted) 61.6 ± 21.1 65.0 ± 21.6 .517
DLCO, diffusing capacity of carbon monoxide; FEV 1, forced expiratory volume in one second; FRC, functional residual capacity; RV, residual volume; TLC, total lung capacity; VC, vital capacity.
Pulmonary function data are expressed as percentages of predicted normal values established by the European Respiratory Society . Data are mean ± standard deviation of the mean.
Get Radiology Tree app to read full this article<
Variability of CT Airways Measurements and Spirometric Measurements
Get Radiology Tree app to read full this article<
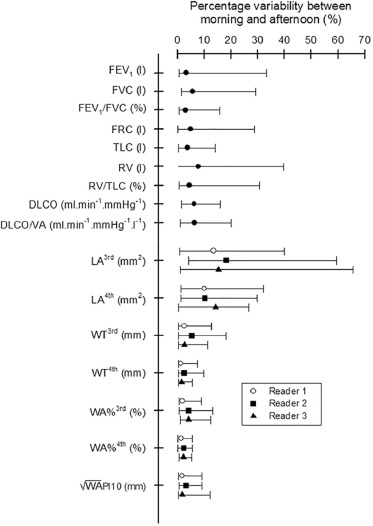
TABLE 2
Comparison of Variability of CT Airways Measurements and Spirometric Measurements
P Values WAPi10 (mm) vs. FEV 1 (L) .091 WAPi10 (mm) vs. FEV 1 /FVC (%) .809 WT 3rd (mm) vs. FEV 1 (L) .748 WT 3rd (mm) vs. FEV 1 /FVC (%) .126 LA 3rd (mm 2 ) vs. FEV 1 (L).008 \* LA 3rd (mm 2 ) vs. FEV 1 /FVC (%)<.001 \* WA% 3rd (%) vs. FEV 1 (L) .573 WA% 3rd (%) vs. FEV 1 /FVC (%) .212 WT 4th (mm) vs. FEV 1 (L) .099 WT 4th (mm) vs. FEV 1 /FVC (%) .717 LA 4th (mm 2 ) vs. FEV 1 (L).033 \* LA 4th (mm 2 ) vs. FEV 1 /FVC (%)<.001 \* WA% 4th (%) vs. FEV 1 (L) .077 WA% 4th (%) vs. FEV 1 /FVC (%) .935
√WAPi10, square root of wall area at an internal perimeter of 10 mm; FEV1, forced expiratory volume in one second; FVC, forced vital capacity; LA, luminal area; WA%, percentage of total airway area occupied by the wall; WT, wall thickness.
P values in bold demonstrate significance.
Get Radiology Tree app to read full this article<
Get Radiology Tree app to read full this article<
CT Airways Measurements
Get Radiology Tree app to read full this article<
TABLE 3
CT Airways Measurements—Effects of Measurement Session, Reader, and Time of CT Examination
CT Examination in the Morning CT Examination in the Afternoon Effect of Effect of Effect of Time of Reader 1 Reader 2 Reader 3 Reader 1 Reader 2 Reader 3 Session Reader Examination Session 1 Session 2 Session 1 Session 2 Session 1 Session 2 Session 1 Session 2 Session 1 Session 2 Session 1 Session 2P Values_P_ Values_P_ Values All measured airways Number 16 ± 7 16 ± 6 14 ± 5 15 ± 5 11 ± 5 11 ± 5 16 ± 6 17 ± 8 15 ± 5 16 ± 6 11 ± 5 12 ± 5 >.999<.001 .303 √WAPi10 (mm) 4.58 ± 0.29 4.68 ± 0.34 4.52 ± 0.29 4.58 ± 0.53 4.66 ± 0.33 4.66 ± 0.29 4.60 ± 0.27 4.62 ± 0.32 4.51 ± 0.23 4.56 ± 0.43 4.60 ± 0.22 4.60 ± 0.23 .428<.001 .712 Third generation airways Number 4 ± 2 4 ± 2 3 ± 2 3 ± 2 3 ± 2 3 ± 2 4 ± 2 4 ± 3 4 ± 2 4 ± 2 3 ± 1 3 ± 1 >.999<.001 .784 LA 3rd (mm 2 ) 13.7 ± 3 13.7 ± 3.2 16.2 ± 4.3 15.1 ± 4.0 16.4 ± 7.5 16.6 ± 7.3 12.7 ± 3.1 13.5 ± 2.6 14.3 ± 3.8 16.5 ± 4.8 14.5 ± 4.4 14.5 ± 3.8 >.999<.001.018 WT 3rd (mm) 1.49 ± 0.16 1,47 ± 0.15 1.45 ± 0.15 1.48 ± 0.17 1.48 ± 0.13 1.49 ± 0.13 1.47 ± 0.15 1.46 ± 0.16 1.46 ± 0.17 1.46 ± 0.17 1.47 ± 0.13 1.46 ± 0.13 >.999 >.999 .439 WA% 3rd (%) 66.4 ± 2.6 65.9 ± 2.8 63.2 ± 3.4 64.0 ± 4.6 64.5 ± 5.5 64.3 ± 5.4 67.1 ± 2.9 66.2 ± 2.3 65.2 ± 4.0 63.5 ± 3.6 65.2 ± 3.2 65.2 ± 3.3 >.999<.001.005 Fourth generation airways Number 12 ± 6 12 ± 5 11 ± 5 12 ± 5 8 ± 4 8 ± 4 12 ± 6 13 ± 7 11 ± 4 12 ± 5 8 ± 5 9 ± 5 .432<.001 .108 LA 4th (mm 2 ) 10.9 ± 2.7 10.5 ± 2.7 11.0 ± 2.8 10.6 ± 2.9 11.5 ± 2.7 11.4 ± 2.6 10.6 ± 2.4 10.6 ± 2.8 10.6 ± 2.8 10.4 ± 2.4 10.9 ± 2.7 11.1 ± 2.6 .952.005 .102 WT 4th (mm) 1.46 ± 0.13 1.49 ± 0.16 1.44 ± 0.14 1.44 ± 0.16 1.47 ± 0.12 1.47 ± 0.12 1.45 ± 0.11 1.45 ± 0.12 1.42 ± 0.10 1.42 ± 0.14 1.46 ± 0.11 1.45 ± 0.11 >.999<.001.010 WA% 4th (%) 69.1 ± 2.0 70.1 ± 1.4 68.7 ± 1.7 69.1 ± 2.4 68.6 ± 2.5 68.7 ± 2.5 69.3 ± 2.2 69.5 ± 2.1 68.8 ± 2.4 69.1 ± 2.0 69.2 ± 2.6 69.0 ± 2.5 .535.028 .484
√WAPi10, square root of wall area at an internal perimeter of 10 mm; LA, luminal area; WA%, percentage of total airway area occupied by the wall; WT, wall thickness.
Data are mean ± standard deviation of the mean. P values in bold demonstrate significance.
Get Radiology Tree app to read full this article<
Discussion
Get Radiology Tree app to read full this article<
Get Radiology Tree app to read full this article<
Get Radiology Tree app to read full this article<
Get Radiology Tree app to read full this article<
Get Radiology Tree app to read full this article<
Get Radiology Tree app to read full this article<
Get Radiology Tree app to read full this article<
Get Radiology Tree app to read full this article<
Get Radiology Tree app to read full this article<
Get Radiology Tree app to read full this article<
Get Radiology Tree app to read full this article<
References
1. Global Initiative for Chronic Obstructive Lung Disease : Global Strategy for the Diagnosis, Management and Prevention of COPD. Available at http://www.goldcopd.org/
2. Wedzicha J.E.: The heterogeneity of chronic obstructive pulmonary disease. Thorax 2000; 55: pp. 631-632.
3. Han M.K., Agusti A., Calverley P.M., et. al.: Chronic obstructive pulmonary disease phenotypes. The future of COPD. Am J Respir Crit Care Med 2010; 182: pp. 598-604.
4. Fishman A., Martinez F., Naunheim K., et. al., National Emphysema Treatment Trial Research Group: A randomized trial comparing lung-volume-reduction surgery with medical therapy for severe emphysema. N Engl J Med 2003; 348: pp. 2059-2073.
5. Fujimoto K., Kitaguchi Y., Kubo K., et. al.: Clinical analysis of chronic obstructive pulmonary disease phenotypes classified using high-resolution computed tomography. Respirology 2006; 11: pp. 731-740.
6. Kitaguchi Y., Fujimoto K., Kubo K., et. al.: Characteristics of COPD phenotypes classified according to the findings of HRCT. Respir Med 2006; 100: pp. 1742-1752.
7. Martinez F.J., Foster G., Curtis J.L., et. al., National Emphysema Treatment Trial Research Group: Predictors of mortality in patients with emphysema and severe airflow obstruction. Am J Respir Crit Care Med 2006; 173: pp. 1326-1334.
8. Lynch D.A., Al-Qaisi M.A.: Quantitative computed tomography in chronic obstructive pulmonary disease. J Thorac Imaging 2013; 28: pp. 284-290.
9. Nakano Y., Muro S., Sakai H., et. al.: Computed tomographic measurements of airway dimensions and emphysema in smokers. Am J Respir Crit Care Med 2000; 162: pp. 1102-1108.
10. Nakano Y., Wong J.C., de Jong P.A., et. al.: The prediction of small airway dimensions using computed tomography. Am J Respir Crit Care Med 2005; 171: pp. 142-146.
11. Hasegawa M., Nasuhara Y., Onodera Y., et. al.: Airflow limitation and airway dimensions in chronic obstructive pulmonary disease. Am J Respir Crit Care Med 2006; 173: pp. 1309-1315.
12. Grydeland T.B., Dircksen A., Coxson H.O., et. al.: Quantitative computed tomography: emphysema and airway wall thickness by sex, age and smoking. Eur Respir J 2009; 34: pp. 858-865.
13. Hackx M., Gyssels E., Severo Garcia T., et. al.: CT quantification of airways dimensions in COPD patients: numbers of airways to measure and effect of bronchodilation. Radiology 2015; 277: pp. 853-862.
14. Shimizu K., Seto R., Makita H., et. al.: Computed tomography (CT)-assessed bronchodilation induced by inhaled indacaterol and glycopyrronium/indacaterol in COPD. Respir Med 2016; 119: pp. 70-77.
15. Sanders C., Nath P.H., Bailey W.C.: Detection of emphysema with computed tomography: correlation with pulmonary function tests and chest radiography. Invest Radiol 1988; 23: pp. 262-266.
16. Caverley P.M.A., Lee A., Towse L., et. al.: Effect of tiotropium bromide on circadian variation in airflow limitation in chronic obstructive pulmonary disease. Thorax 2003; 58: pp. 855-860.
17. Quanjer P., Tammeling G.J., Cotes J.E., et. al.: Lung volumes and forced ventilatory flows. Eur Respir J 1993; 6: pp. 5-40.
18. Cotes J.E., Chinn D.J., Quanjer P.H., et. al.: Standardization of the measurement of transfer factor (diffusing capacity). Eur Respir J 1993; 6: pp. 41-52.
19. Fisher R.A., Yates F.: Statistical tables for biological, agricultural and medical research.1963.Oliver and BoydLondon, England
20. American Association of Physicists in Medicine : Size-specific dose estimates (SSDE) in pediatric and adult body CT examinations. Report 204. AAPM Task Group 204 of the Diagnostic Imaging Council CT Committee. College Park, Md, USA2011.
21. Faul F., Erdfelder E., Lang A.G., et. al.: G*Power 3: a flexible statistical power analysis program for the social, behavioral, and biomedical sciences. Behav Res Methods 2007; 39: pp. 175-191.
22. R Development Core Team : R: A language and environment for statistical computing. R Foundation for Statistical Computing 2013; Vienna, Austria; Available at http://www.r-project.org/
23. Dirksen A., Dijkman J.H., Madsen F., et. al.: A randomized clinical trial of α1-antitrypsin augmentation therapy. Am J Respir Crit Care Med 1999; 160: pp. 1468-1472.
24. Han M.K., Kazerooni E.A., Lynch D.A., et. al.: Chronic obstructive pulmonary disease exacerbations in the COPDGene study: associated radiologic phenotypes. Radiology 2011; 261: pp. 274-282.
25. Gietema H.A., Edwards L.D., Coxson H.O., et. al.: ECLIPSE Investigators. Impact of emphysema and airway wall thickness on quality of life in smoking-related COPD. Respir Med 2013; 107: pp. 1201-1209.
26. Xie X., de Jong P.A., Oudkerk M., et. al.: Morphological measurements in computed tomography correlate with airflow obstruction in chronic obstructive pulmonary disease: systematic review and meta-analysis. Eur Radiol 2012; 22: pp. 2085-2093.
27. Achenbach T., Weinhemer O., Brochhausen C., et. al.: Accuracy of automatic airway morphometry in computed tomography—correlation of radiologic-pathological findings. Eur J Radiol 2012; 81: pp. 183-188.
28. Lutey B.A., Conradi S.H., Atkinson J.J., et. al.: Accurate measurement of small airways on low-dose thoracic CT scans in smokers. Chest 2013; 143: pp. 1321-1329.
29. Hague C.J., Krowchuk N., Alhassan D., et. al.: Qualitative and quantitative assessment of smoking-related lung disease: effect of iterative reconstruction on low-dose computed tomographic examinations. J Thorac Imaging 2014; 29: pp. 350-356.
30. Schroeder J.D., McKenzie A.S., Zach J.A., et. al.: Relationships between airflow obstruction and quantitative CT measurements of emphysema, air trapping, and airways in subjects with and without chronic obstructive pulmonary disease. AJR Am J Roentgenol 2013; 201: pp. W460-W470.
31. Kiraly A.P., Odry B.L., Naidich D.P., et. al.: Boundary-specific cost functions for quantitative airway analysis. Med Image Comput Comput Assist Interv 2007; 10: pp. 784-791.
32. Galbán C.J., Han M.K., Boes J.L., et. al.: Computed tomography-based biomarker provides unique signature for diagnosis of COPD phenotypes and disease progression. Nat Med 2012; 18: pp. 1711-1715.
33. Walsdorff M., Van Muylem A., Gevenois P.A.: Effect of total lung capacity and gender on CT densitometry indexes. Br J Radiol 2016; 89: pp. 20150631.
34. Hackx M., Francotte D., Garcia T.S., et. al.: Effect of total lung capacity, gender and height on CT airway measurements. Br J Radiol 2017; 90: pp. 20160898.
35. Ohara T., Hirai T., Sato S., et. al.: Longitudinal study of airway dimensions in chronic obstructive pulmonary disease using computed tomography. Respirology 2008; 13: pp. 372-378.
36. Takayanagi S., Kawata N., Tada Y., et. al.: Longitudinal changes in structural abnormalities using MDCT in COPD: do the CT measurements of airway wall thickness and small pulmonary vessels change in parallel with emphysematous progression?. Int J Chron Obstruct Pulmon Dis 2017; 12: pp. 551-560.