
Rationale and Objectives
To compare Hounsfield unit (HU) data obtained from true-unenhanced (TUE) and virtual-unenhanced (VUE) imaging obtained with a fast kv-switching dual-energy computed tomography (CT) scanner using multimaterial decomposition algorithm.
Materials and Methods
In this Institutional Review Board-approved, Health Insurance Portability and Accountability Act-compliant, retrospective cohort study, CT scans of 19 patients undergoing multiphasic renal protocol abdominal CT on a fast kv-switching dual-energy CT scanner were reviewed. CT numbers were measured on the matched TUE and VUE generated using a multimaterial decomposition algorithm with selective iodine suppression, and postcontrast images at predefined locations in seven organs. Six hundred sixty regions of interest were placed at 132 locations. Agreement was assessed with paired t test, Pearson’s correlation, and Bland-Altman analysis.
Results
Mean TUE and VUE measurements were not significantly different in the corticomedullary ( P = 0.25) or nephrographic ( P = 0.10) phases. There was a strong correlation between TUE and VUE CT numbers (corticomedullary: r = 0.90, nephrographic: r = 0.90, each P < 0.001). Discrepancies ≥5 HU occurred 46 times (35%, 46 of 132) in the corticomedullary phase and 44 times (33%, 44 of 132) in the nephrographic phase. Discrepancies ≥10 HU occurred in 7% (9 of 132 in both corticomedullary and nephrographic phases). Interphase, intrasubject VUE CT numbers were strongly correlated ( r = 0.93, P < 0.001), but discrepancies ≥5 HU (22% [29 of 132]) and ≥10 HU (2% [3 of 132]) occurred. There was no significant correlation between the true postcontrast CT number and the magnitude of VUE-TUE discrepancy ( r = −0.04, P = 0.6).
Conclusion
CT numbers on VUE images generated from fast kv-switching dual-energy CT scans strongly correlate with TUE CT numbers on a population basis, but commonly vary 5–9 HU on a per-patient basis.
Introduction
One of the principal advantages of dual-energy computed tomography (DECT) is its ability to derive material-specific information using material decomposition algorithms that analyze the change in attenuation of tissues between the low and high-energy scans . This enables differentiation of materials with a high atomic number (eg, iodine) from those with a low atomic number (eg, soft tissue, water). With fast kv-switching DECT, a “basis material decomposition algorithm” is used to generate material-specific information that enables selective identification of iodine on contrast-enhanced DECT and generation of virtual unenhanced (VUE) images . However, unlike with dual-source DECT, in which material decomposition is performed in image space, material decomposition with fast kv-switching DECT is performed in projection space, which has limited the ability of users to translate the VUE data into Hounsfield units (HU) .
An advanced material analysis algorithm known as multimaterial decomposition (MMD) has recently been made available for clinical use, and extends the material discrimination capability of fast kv-switching DECT to more than two materials . As opposed to VUE images generated using an iodine:water material basis pair, in which the image pixels containing iodine are removed, with MMD algorithm image voxels of iodine are replaced by voxels simulating the same volume and attenuation of blood that would have been displaced by the iodine . These images are referred to as material suppressed iodine (MSI) images, and they enable measurement of HU in the VUE images . If accurate, they would allow the translation of these virtual HU data into commonly used attenuation-based diagnostic algorithms (eg, renal mass and adrenal nodule characterization) that rely on specific HU criteria to discriminate benign from potentially malignant pathology .
Get Radiology Tree app to read full this article<
Get Radiology Tree app to read full this article<
Materials and Methods
Get Radiology Tree app to read full this article<
Study Subjects
Get Radiology Tree app to read full this article<
CT Technique
Get Radiology Tree app to read full this article<
Get Radiology Tree app to read full this article<
Image Analysis
Get Radiology Tree app to read full this article<
Effective Dose Estimation
Get Radiology Tree app to read full this article<
Statistical Analysis
Get Radiology Tree app to read full this article<
Get Radiology Tree app to read full this article<
Get Radiology Tree app to read full this article<
Results
Get Radiology Tree app to read full this article<
Table 1
Mean CT Numbers and Standard Deviations of TUE and VUE Data From Fast kv-Switching Dual-energy CT Using a Multimaterial Decomposition Algorithm
Organ TUE HU±SD Corticomedullary
VUE HU±SD_P_ Value Nephrographic
VUE HU±SD_P_ Value Aorta ( n = 19) 36.4 ± 6.1 36.7 ± 3.4 0.84 30.8 ± 3.6 0.002 \* Erector spinae ( n = 19) 42.0 ± 7.6 38.8 ± 7.4 0.19 39.5 ± 8.1 0.33 Kidney ( n = 19) 30.5 ± 3.3 29.7 ± 4.8 0.53 29.2 ± 3.8 0.24 Liver ( n = 19) 54.0 ± 7.1 49.3 ± 7.2 0.05 51.1 ± 5.6 0.18 Portal vein ( n = 19) 32.2 ± 6.6 31.8 ± 6.2 0.88 30.8 ± 5.7 0.51 Pancreas ( n = 19) 28.1 ± 9.3 27.7 ± 8.1 0.89 27.5 ± 7.6 0.82 Spleen ( n = 18) 44.1 ± 5.1 43.2 ± 4.4 0.58 43.6 ± 3.4 0.70 All organs ( n = 132) 38.1 ± 10.7 36.7 ± 9.4 0.25 36.0 ± 9.9 0.10
CT, computed tomography; HU, Hounsfield unit; SD, standard deviation; TUE, true unenhanced; VUE, virtual unenhanced.
P values are repeated univariate comparisons of TUE and VUE data.
Get Radiology Tree app to read full this article<
Table 2
Rate of Discrepancies of HU Measurements Between TUE and VUE Data, and Between Different Phases of Examination Derived From Fast kv-Switching Dual-energy CT Using a Multimaterial Decomposition Algorithm
Discrepancies < 5 HU Discrepancies ≥ 5 HU – < 10 HU Discrepancies ≥ 10 HU TUE vs VUE corticomedullary 58% (77/132) 35% (46/132) 7% (9/132) TUE vs VUE nephrographic 60% (79/132) 33% (44/132) 7% (9/132) VUE corticomedullary vs VUE nephrographic 76% (100/132) 22% (29/132) 2% (3/132)
CT, computed tomography; HU, Hounsfield unit, TUE, true unenhanced, VUE, virtual unenhanced.
Get Radiology Tree app to read full this article<
Get Radiology Tree app to read full this article<
Table 3
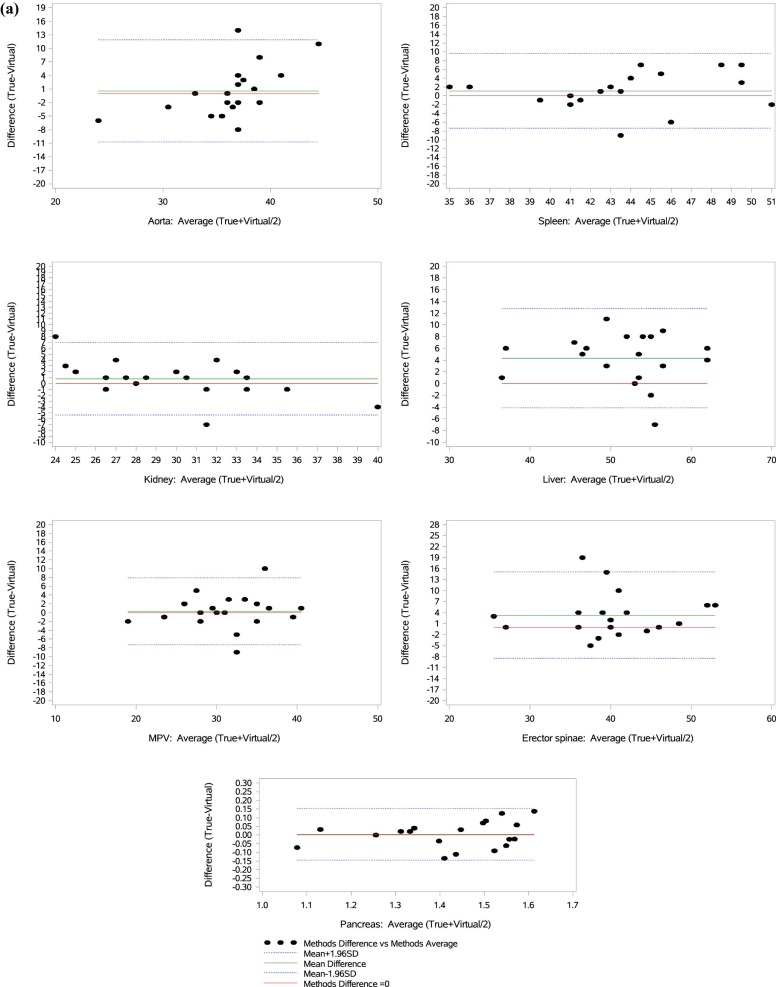
Mean Differences (ie, Bias), Standard Deviations (±), and Limits of Agreement Between True Unenhanced and Virtual Unenhanced Data From Fast kv-Switching Dual-energy CT Using a Multimaterial Decomposition Algorithm
Organ Corticomedullary Phase Nephrographic Phase Mean Difference ±SD_P_ Value Limits of Agreement (Mean Bias with 95% CI) Mean Difference ±SD_P_ Value Limits of Agreement (Mean Bias with 95% CI) Aorta 0.6 ± 5.8 0.67 (-10.7, 11.9) 6.2 ± 6.0 <0.001 \* (-5.6, 18.0) Erector spinae 3.3 ± 6.0 0.02 \* (-8.5, 15.1) 2.3 ± 5.8 0.10 (-9.0, 13.6) Kidney 0.8 ± 3.2 0.29 (-5.4, 7.0) 1.3 ± 2.5 0.04 \* (-3.6, 6.1) Liver 4.3 ± 4.3 <0.001 \* (-4.2, 12.8) 2.8 ± 3.3 0.001 \* (-3.6, 9.3) Portal vein 0.3 ± 3.9 0.73 (-7.3, 7.9) 1.3 ± 4.8 0.24 (-8.0, 10.7) Pancreas 0.6 ± 5.6 0.66 (-10.4, 11.5) 0.8 ± 5.2 0.95 (-9.4, 11.1) Pancreas (LOG) \\ 0.003 ± 0.08 0.85 (0.7, 1.4) 0.004 ± 0.07 0.80 (0.7, 1.4) Spleen 1.1 ± 4.3 0.38 (-7.3, 9.6) 0.9 0.29 (-7.4, 9.2)
CI, confidence interval; CT, computed tomography; SD, standard deviation.
P values represent the statistical significance of mean differences.
Get Radiology Tree app to read full this article<
Get Radiology Tree app to read full this article<
Table 4
Determination of Systematic Bias by Bland-Altman Approach: Correlation Between Absolute Differences and Average Hounsfield Unit Measurements Between True Unenhanced and Virtual Unenhanced Data Generated From Fast kv-Switching Dual-energy CT Using a Multimaterial Decomposition Algorithm
Organ Corticomedullary Nephrographic Aorta 0.41 0.08 Erector spinae 0.94 0.61 Kidney 0.71 0.48 Liver 0.73 0.22 Portal vein 0.58 0.15 Pancreas 0.004 \* 0.02 \* Pancreas (LOG) 0.34 \\ 0.06 \\ Spleen 0.06 0.37
CT, computed tomography;
Data are P values from Pearson correlation statistics.
Get Radiology Tree app to read full this article<
Get Radiology Tree app to read full this article<
Get Radiology Tree app to read full this article<
Get Radiology Tree app to read full this article<
Discussion
Get Radiology Tree app to read full this article<
Get Radiology Tree app to read full this article<
Get Radiology Tree app to read full this article<
Get Radiology Tree app to read full this article<
Get Radiology Tree app to read full this article<
Get Radiology Tree app to read full this article<
Get Radiology Tree app to read full this article<
Acknowledgements
Get Radiology Tree app to read full this article<
Get Radiology Tree app to read full this article<
References
1. Alvarez R.E., Macovski A.: Energy-selective reconstructions in X-ray computerized tomography. Phys Med Biol 1976; 21: pp. 733-744. PubMed PMID: 967922; Epub 1976/09/01. eng
2. Johnson T.R., Krauss B., Sedlmair M., et. al.: Material differentiation by dual energy CT: initial experience. Eur Radiol 2007; 17: pp. 1510-1517. Epub 2006/12/08. eng 17151859
3. McCollough C.H., Leng S., Yu L., et. al.: Dual- and multi-energy CT: principles, technical approaches, and clinical applications. Radiology 2015; 276: pp. 637-653. Epub 2015/08/25. eng 26302388 Pubmed Central PMCID: PMC4557396
4. Kaza R.K., Platt J.F., Cohan R.H., et. al.: Dual-energy CT with single- and dual-source scanners: current applications in evaluating the genitourinary tract. Radiographics 2012; 32: pp. 353-369. Epub 2012/03/14. eng 22411937
5. Marin D., Boll D.T., Mileto A., et. al.: State of the art: dual-energy CT of the abdomen. Radiology 2014; 271: pp. 327-342. Epub 2014/04/26. eng 24761954
6. Mendonca P.R., Lamb P., Sahani D.V.: A flexible method for multi-material decomposition of dual-energy CT images. IEEE Trans Med Imaging 2014; 33: pp. 99-116. Epub 2013/09/24. eng 24058018
7. Israel G.M., Bosniak M.A.: How I do it: evaluating renal masses. Radiology 2005; 236: pp. 441-450. Epub 2005/07/26. eng 16040900
8. Kaufmann S., Sauter A., Spira D., et. al.: Tin-filter enhanced dual-energy-CT: image quality and accuracy of CT numbers in virtual noncontrast imaging. Acad Radiol 2013; 20: pp. 596-603. Epub 2013/03/16. eng 23490736
9. Sahni V.A., Shinagare A.B., Silverman S.G.: Virtual unenhanced CT images acquired from dual-energy CT urography: accuracy of attenuation values and variation with contrast material phase. Clin Radiol 2013; 68: pp. 264-271. Epub 2012/09/15. eng 22974566
10. Toepker M., Moritz T., Krauss B., et. al.: Virtual non-contrast in second-generation, dual-energy computed tomography: reliability of attenuation values. Eur J Radiol 2012; 81: pp. e398-e405. Epub 2012/01/13. eng 22236702
11. Mountford P.J., Temperton D.H.: Recommendations of the International Commission on Radiological Protection (ICRP) 1990. Eur J Nucl Med 1992; 19: pp. 77-79. 1563443
12. Bland J.M., Altman D.G.: Statistical methods for assessing agreement between two methods of clinical measurement. Lancet 1986; 1: pp. 307-310. Epub 1986/02/08. eng 2868172
13. Altman D.G., Bland J.M.: Measurement in medicine—the analysis of method comparison studies. Statistician 1983; 32: pp. 307-317. PubMed PMID: WOS:A1983RP04600005. English
14. Anvari A., Halpern E.F., Samir A.E.: Statistics 101 for radiologists. Radiographics 2015; 35: pp. 1789-1801. 26466186
15. Bland J.M., Altman D.G.: Measuring agreement in method comparison studies. Stat Methods Med Res 1999; 8: pp. 135-160. PubMed PMID: WOS:000083700100004. English
16. Miller C.M., Gupta R.T., Paulson E.K., et. al.: Effect of organ enhancement and habitus on estimation of unenhanced attenuation at contrast-enhanced dual-energy MDCT: concepts for individualized and organ-specific spectral iodine subtraction strategies. AJR Am J Roentgenol 2011; 196: pp. W558-W564. Epub 2011/04/23. eng 21512045
17. American College of Radiology Appropriateness Criteria : Radiation Dose Assessment Introduction. [ Last review date: Sep; Last accessed: September 7, 2016; Available from: http://www.acr.org/~/media/ACR/Documents/AppCriteria/RadiationDoseAssessmentIntro.pdf