
Rationale and Objectives
Patients’ willingness to travel farther distances for certain imaging services may reflect their perceptions of the degree of differentiation of such services. We compare patients’ travel times for a range of imaging examinations performed across a large academic health system.
Materials and Methods
We searched the NYU Langone Medical Center Enterprise Data Warehouse to identify 442,990 adult outpatient imaging examinations performed over a recent 3.5-year period. Geocoding software was used to estimate typical driving times from patients’ residences to imaging facilities. Variation in travel times was assessed among examination types.
Results
The mean expected travel time was 29.2 ± 20.6 minutes, but this varied significantly (p < 0.001) among examination types. By modality, travel times were shortest for ultrasound (26.8 ± 18.9) and longest for positron emission tomography-computed tomography (31.9 ± 21.5). For magnetic resonance imaging, travel times were shortest for musculoskeletal extremity (26.4 ± 19.2) and spine (28.6 ± 21.0) examinations and longest for prostate (35.9 ± 25.6) and breast (32.4 ± 22.3) examinations. For computed tomography, travel times were shortest for a range of screening examinations [colonography (25.5 ± 20.8), coronary artery calcium scoring (26.1 ± 19.2), and lung cancer screening (26.4 ± 14.9)] and longest for angiography (32.0 ± 22.6). For ultrasound, travel times were shortest for aortic aneurysm screening (22.3 ± 18.4) and longest for breast (30.1 ± 19.2) examinations. Overall, men (29.9 ± 21.6) had longer (p < 0.001) travel times than women (27.8 ± 20.3); this difference persisted for each modality individually (p ≤ 0.006).
Conclusions
Patients’ willingness to travel longer times for certain imaging examination types (particularly breast and prostate imaging) supports the role of specialized services in combating potential commoditization of imaging services. Disparities in travel times by gender warrant further investigation.
Introduction
Much concern has been expressed of the threat of commoditization of radiology services . This in part relates to a fairly consistent patient experience for imaging examinations performed across imaging facilities as well as the lack of face-to-face interaction with radiologists for most noninvasive imaging encounters. As a result, patients may misperceive receiving an imaging examination with a professional interpretation as analogous to undergoing a basic laboratory test. In this case, patients may not necessarily recognize differences in both technical and radiologist quality when having an opportunity to select among imaging facilities, and instead make their decisions largely based on cost or convenience . Such a reality would encourage radiology practices to focus on the latter considerations and disincentivize investments in quality .
The risk of commoditization in radiology is unlikely to be homogeneous across imaging examinations. Radiology encompasses a range of distinct imaging modalities, as well as more granular specific examination types within individual modalities. Such imaging services vary in terms of the abundance and availability of performing facilities within a given region, as well as the nature of the patient experience during an examination. These factors in turn impact patients’ perception of differentiation of a given service.
Get Radiology Tree app to read full this article<
Methods
Get Radiology Tree app to read full this article<
Get Radiology Tree app to read full this article<
Get Radiology Tree app to read full this article<
Get Radiology Tree app to read full this article<
Get Radiology Tree app to read full this article<
Get Radiology Tree app to read full this article<
Get Radiology Tree app to read full this article<
Get Radiology Tree app to read full this article<
Results
Get Radiology Tree app to read full this article<
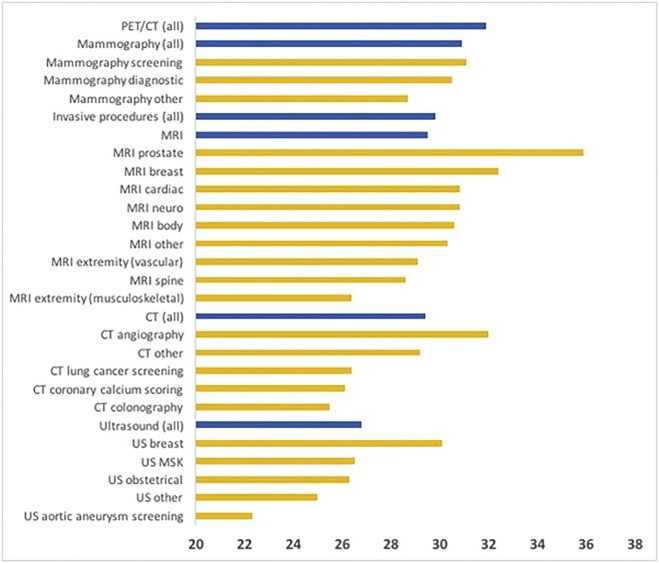
TABLE 1
Travel Times (Minutes) for Adult Outpatient Imaging Examinations at a Single Large Academic Health System
Sample Mean ± SD Entire cohort (p < 0.001 among modalities) 29.2 ± 20.6 PET/CT 31.9 ± 21.5 Mammography (p < 0.001 among examination types) 30.9 ± 19.3 Screening 31.1 ± 18.8 Diagnostic 30.5 ± 19.9 Unspecified 28.7 ± 18.0 Invasive 29.8 ± 21.1 MRI (p < 0.001 among examination types) 29.5 ± 21.4 Prostate 35.9 ± 25.6 Breast 32.4 ± 22.3 Cardiac 30.8 ± 21.1 Neuro 30.8 ± 22.1 Body 30.6 ± 21.5 Other 30.3 ± 18.1 Extremity—vascular 29.1 ± 20.3 Spine 28.6 ± 21.0 Extremity—musculoskeletal 26.4 ± 19.2 CT (p < 0.001 among examination types) 29.4 ± 21.7 Angiography 32.0 ± 22.6 Other 29.2 ± 21.7 Lung cancer screening 26.4 ± 14.9 Coronary artery calcium scoring 26.1 ± 19.2 Colonography 25.5 ± 20.8 Ultrasound (p < 0.001 among examination types) 26.8 ± 18.9 Breast 30.1 ± 19.2 MSK 26.5 ± 18.8 Obstetrical 26.3 ± 17.6 Other 25.0 ± 18.5 Abdominal aortic aneurysm screening 22.3 ± 18.4
CT, computed tomography; MRI, magnetic resonance imaging; MSK, musculoskeletal; PET/CT, positron emission tomography-computed tomography; SD, standard deviation.
Get Radiology Tree app to read full this article<
Get Radiology Tree app to read full this article<
TABLE 2
Comparison of Travel Times (Minutes) to Outpatient Imaging Examinations for Women and Men \*
Sample Women Men p Entire cohort 27.8 ± 20.3 29.9 ± 21.6 <0.001 PET/CT 31.4 ± 21.8 32.5 ± 21.2 0.006 Invasive 29.0 ± 20.5 31.2 ± 22.1 <0.001 MRI 28.7 ± 20.8 30.0 ± 21.6 <0.001 CT 27.8 ± 21.2 30.9 ± 22.2 <0.001 Ultrasound 24.7 ± 17.9 25.8 ± 19.7 <0.001
CT, computed tomography; MRI, magnetic resonance imaging; PET/CT, positron emission tomography-computed tomography.
Get Radiology Tree app to read full this article<
Get Radiology Tree app to read full this article<
Discussion
Get Radiology Tree app to read full this article<
Get Radiology Tree app to read full this article<
Get Radiology Tree app to read full this article<
Get Radiology Tree app to read full this article<
Get Radiology Tree app to read full this article<
Get Radiology Tree app to read full this article<
Get Radiology Tree app to read full this article<
Get Radiology Tree app to read full this article<
References
1. Pressman B.D.: Presidential address: distinction or extinction. J Am Coll Radiol 2008; 5: pp. 1036-1040.
2. Reiner B.I., Siegel E.L.: Decommoditizing radiology. J Am Coll Radiol 2009; 6: pp. 167-170.
3. Krestin G.P.: Commoditization in radiology: threat or opportunity?. Radiology 2010; 256: pp. 338-342.
4. Vianu R.: Diagnosing radiology’s commoditization. Radiol Manage 2014; 36: pp. 9-10.
5. Durand D.J., Narayan A.K., Rybicki F.J., et. al.: The health care value transparency movement and its implications for radiology. J Am Coll Radiol 2015; 12: pp. 51-58.
6. Domina J.G., Bhatti Z.S., Brown R.K., et. al.: JOURNAL CLUB: patient perception of radiology and radiologists: a survey analysis of academic and community institutions. AJR Am J Roentgenol 2016; 207:
7. Hinterhuber A.Liozu S.M.Pricing and the sales force.2016.RoutledgeNew York:
8. Sinaiko A.D., Rosenthal M.B.: Examining a health care price transparency tool: who uses it, and how they shop for care. Health Aff (Millwood) 2016; 35: pp. 662-670.
9. Hofmann P.B.: Price transparency is not enough. Indecipherable billing statements are indefensible. Healthc Exec 2016; 31: pp. 58-59.
10. Meisel Z.F., VonHoltz L.A., Merchant R.M.: Crowdsourcing healthcare costs: opportunities and challenges for patient centered price transparency. Healthcare 2016; 4: pp. 3-5.
11. Desai S., Hatfield L.A., Hicks A.L., et. al.: Association between availability of a price transparency tool and outpatient spending. JAMA 2016; 315: pp. 1874-1881.
12. Alford-Teaster J., Lange J.M., Hubbard R.A., et. al.: Is the closest facility the one actually used? An assessment of travel time estimation based on mammography facilities. Int J Health Geogr 2016; 15: pp. 8.
13. Onega T., Lee C.I., Benkeser D., et. al.: Travel burden to breast MRI and utilization: are risk and sociodemographics related?. J Am Coll Radiol 2016; 13: pp. 611-619.
14. U.S. Census Bureau : American FactFinder. Annual estimates of the resident population: April 1, 2010 to July 1, 2015. Available at: https://factfinder.census.gov/faces/tableservices/jsf/pages/productview.xhtml? March; Accessed February 25, 2017
15. U.S. Census Bureau : Table B-1. Metropolitan areas—area and population. From “State and Metropolitan Area Data Book: 2006”. Available at: https://www.census.gov/prod/2006pubs/smadb/smadb-06tableb.pdf Accessed February 26
16. Association of American Medical Colleges : Integrated academic medical center hospitals. Available at: https://www.aamc.org/download/372006/data/01-97_integrated_academic_medical_center_hospitals.pdf Accessed February 25, 2017
17. Chhor C.M., Mercado C.L.: Integrating customer intimacy into radiology to improve the patient perspective: the case of breast cancer screening. AJR Am J Roentgenol 2016; 206: pp. 265-269.
18. Mayo R.C., Parikh J.R.: Breast imaging: the face of imaging 3.0. J Am Coll Radiol 2016; 13: pp. 1003-1007.
19. Buttimer A.: Customer focus in breast cancer screening services. Int J Health Care Qual Assur 2009; 22: pp. 514-524.
20. Onega T., Hubbard R., Hill D., et. al.: Geographic access to breast imaging for US women. J Am Coll Radiol 2014; 11: pp. 874-882.
21. Onega T., Cook A., Kirlin B., et. al.: The influence of travel time on breast cancer characteristics, receipt of primary therapy, and surveillance mammography. Breast Cancer Res Treat 2011; 129: pp. 269-275.
22. Henry K.A., Boscoe F.P., Johnson C.J., et. al.: Breast cancer stage at diagnosis: is travel time important?. J Community Health 2011; 36: pp. 933-942.
23. Onega T., Duell E.J., Shi X., et. al.: Geographic access to cancer care in the U.S. Cancer 2008; 112: pp. 909-918.
24. Berke E.M., Shi X.: Computing travel time when the exact address is unknown: a comparison of point and polygon ZIP code approximation methods. Int J Health Geogr 2009; 8: pp. 23.
25. Elkin E.B., Ishill N.M., Snow J.G., et. al.: Geographic access and the use of screening mammography. Med Care 2010; 48: pp. 349-356.
26. Peipins L.A., Miller J., Richards T.B., et. al.: Characteristics of US counties with no mammography capacity. J Community Health 2012; 37: pp. 1239-1248.
27. Kempe K.L., Larson R.S., Shetterley S., et. al.: Breast cancer screening in an insured population: whom are we missing?. Perm J 2013; 17: pp. 38-44.
28. Huang B., Dignan M., Han D., et. al.: Does distance matter? Distance to mammography facilities and stage at diagnosis of breast cancer in Kentucky. J Rural Health 2009; 25: pp. 366-371.
29. Onitilo A.A., Liang H., Stankowski R.V., et. al.: Geographical and seasonal barriers to mammography services and breast cancer stage at diagnosis. Rural Remote Health 2014; 14: pp. 2738.
30. Lian M., Struthers J., Schootman M.: Comparing GIS-based measures in access to mammography and their validity in predicting neighborhood risk of late-stage breast cancer. PLoS ONE 2012; 7: pp. e43000.