
Rationale and Objectives
Hyperpolarized 3 He magnetic resonance imaging (MRI) ventilation abnormalities are visible in ex-smokers without airflow limitation, but the clinical relevance of this is not well-understood. Our objective was to phenotype healthy ex-smokers with normal and abnormally elevated ventilation defect percent (VDP).
Materials and Methods
Sixty ex-smokers without airflow limitation provided written informed consent to 3 He MRI, computed tomography (CT), and pulmonary function tests in a single visit. 3 He MRI VDP and apparent diffusion coefficients (ADCs) were measured for whole-lung and each lung lobe as were CT measurements of emphysema (relative area [RA] with attenuation ≤−950 HU, RA 950 ) and airway morphology (wall area percent [WA%], lumen area [LA] and LA normalized to body surface area [LA/BSA]).
Results
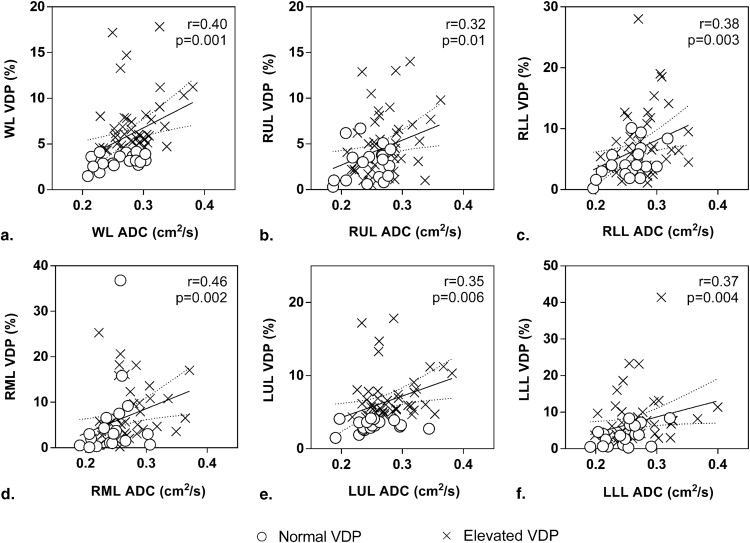
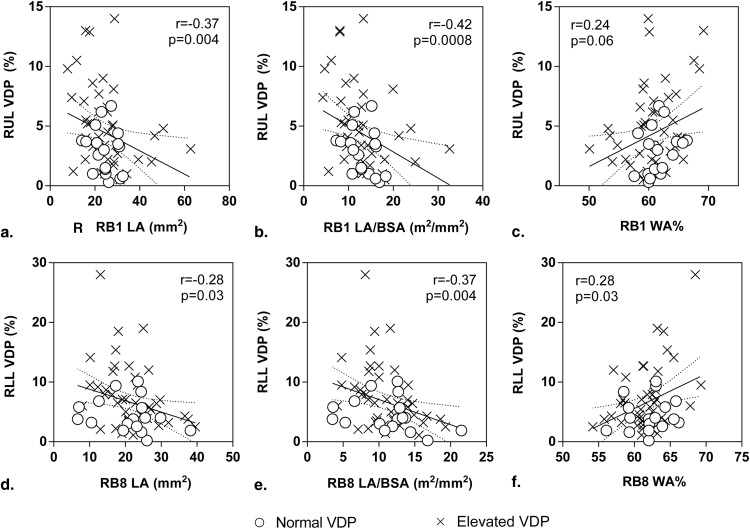
In 42 ex-smokers, there was abnormally elevated VDP and no significant differences for pulmonary function, RA 950 , or airway measurements compared to 18 ex-smokers with normal VDP. Ex-smokers with abnormally elevated VDP reported significantly greater 3 He ADC in the apical lung (right upper lobe [RUL], P = .02; right middle lobe [RML], P = .04; and left upper lobe [LUL], P = .009). Whole lung (r = 0.40, P = .001) and lobar VDP (RUL, r = 0.32, P = .01; RML, r = 0.46, P = .002; right lower lobe [RLL], r = 0.38, P = .003; LUL, r = 0.35, P = .006; and left lower lobe, r = 0.37, P = .004) correlated with regional 3 He ADC. Although whole-lung VDP and CT airway morphology measurements were not correlated, regional VDP was correlated with RUL LA (r = −0.37, P = .004), LA/BSA (r = −0.42, P = .0008), RLL WA% (r = 0.28, P = .03), LA (r = −0.28, P = .03), and LA/BSA (r = −0.37, P = .004).
Conclusions
Abnormally elevated VDP in ex-smokers without airflow limitation was coincident with very mild emphysema detected using MRI and regional airway remodeling detected using CT representing a subclinical obstructive lung disease phenotype.
Chronic obstructive pulmonary disease (COPD) is characterized by irreversible airflow limitation caused by small airway remodeling, airway obliteration , and emphysematous tissue destruction . COPD is typically diagnosed after respiratory symptoms become obvious and intolerable , and this usually occurs when spirometry measurements of lung function reflect airflow limitation and obstruction. However, it is well understood that ex- and current-smokers may report normal lung function and mild symptoms, and this may represent an early or “subclinical” phase. A deep understanding of the underlying morphologic changes that accompany this “subclinical” phase is lacking, mainly because methods for evaluating pulmonary function cannot detect very mild or early structure–function abnormalities.
Hyperpolarized 3 He magnetic resonance imaging (MRI) ventilation heterogeneity has been shown in patients with pulmonary diseases such as COPD , asthma , and cystic fibrosis . At the same time, however, preclinical or subclinical 3 He ventilation heterogeneity has also been observed in volunteers without clinical signs or symptoms of lung disease such as healthy elderly never-smokers , ex-smokers without airflow limitation , in second-hand smoke exposed adults , and current-smokers without disease . To evaluate the underlying anatomic and structural determinants of ventilation heterogeneity, thoracic x-ray computed tomography (CT) has been used to help determine the spatial relationship of airways disease and emphysema with ventilation abnormalities. For example, recent work provided evidence that in COPD, 3 He ventilation defects represent regions of emphysema and airways disease and that this relationship depends on disease severity. In asthma , 3 He ventilation heterogeneity was also shown to be spatially related to abnormally remodeled airways. However, the pathophysiological origins and contributions of very mild or subclinical airways disease and emphysema to ventilation heterogeneity in ex-smokers without airflow limitation have not been investigated and remain poorly understood.
Get Radiology Tree app to read full this article<
Materials and methods
Study Participants
Get Radiology Tree app to read full this article<
Spirometry and Plethysmography
Get Radiology Tree app to read full this article<
Imaging
Get Radiology Tree app to read full this article<
Get Radiology Tree app to read full this article<
Image Analysis
Get Radiology Tree app to read full this article<
Get Radiology Tree app to read full this article<
95%CL=x¯+1.96·σn√ 95
%
CL
=
x
¯
+
1.96
·
σ
n
where x¯ x
¯ is the mean VDP of the 51 healthy never-smokers, σ σ is the standard deviation of VDP of the 51 healthy never-smokers, and n is the total number of healthy never-smokers. The upper limit of normal (95% CI) for VDP was calculated to be 4.3%. Therefore, ex-smokers with VDP <4.3% were classified as normal, whereas ex-smokers with VDP ≥4.3% were classified as having abnormally elevated VDP.
Get Radiology Tree app to read full this article<
Get Radiology Tree app to read full this article<
Get Radiology Tree app to read full this article<
Statistics
Get Radiology Tree app to read full this article<
Results
Get Radiology Tree app to read full this article<
Table 1
Demographic, Pulmonary Function, and Imaging Data
Parameter (±SD) All n = 60 Normal VDP ( n = 18) Elevated VDP ( n = 42)P Value ∗ Age, y 69 (9) 67 (10) 70 (9) .23 (1.0) Male, n (%) 38 (63) 9 (50) 29 (69) .17 (1.0) Pack years 28 (16) 27 (14) 28 (17) .86 (1.0) Years quit smoking 19 (15) 13 (12) 21 (15) .06 (1.0) BMI, kg/m 2 29 (4) 29 (5) 30 (4) .5 (1.0) FVC, % pred 97 (13) 100 (10) 95 (14) .18 (1.0) FEV 1 , % pred 104 (13) 106 (12) 102 (14) .28 (1.0) FEV 1 /FVC 80 (6) 80 (6) 80 (6) .78 (1.0) RV/TLC, % pred 103 (15) 104 (12) 103 (16) .76 (1.0) DL CO , % pred 80 (20) 87 (16) 77 (22) .11 (1.0) 6MWD, m 404 (95) 433 (81) 392 (98) .12 (1.0) SGRQ total 36 (26) 22 (20) 23 (22) .78 (1.0) WA % 65 (2) 65 (2) 65 (2) .89 (0.89) LA, mm 2 14 (3) 13 (2) 14 (4) .36 (1.0) LA/BSA, mm 2 /m 2 7 (2) 7 (1) 7 (2) .81 (1.0) Airway count 115 (37) 106 (28) 119 (40) .20 (1.0) RA 950 , % 1.2 (1.0) 0.8 (0.5) 1.4 (1.1) .08 (1.0) VDP, % 6 (3) 3 (1) 7 (3) <.0001 (<.0001) ADC, cm 2 /s 0.28 (0.04) 0.26 (0.03) 0.29 (0.03) .01 (.18)
ADC, apparent diffusion coefficient; BMI, body mass index; BSA, body surface area; DL CO , diffusing capacity for carbon monoxide; FEV 1 , forced expiratory volume in 1 second; FVC, forced vital capacity; LA, mean fifth generation airway lumen area; 6MWD, six-minute walk distance; RA 950 , relative area of the lung parenchyma with attenuation ≤−950 HU; RV, residual volume; SD, standard deviation; SGRQ, St. Georges Respiratory Questionnaire; TLC, total lung capacity; VDP, ventilation defect percent; WA%, mean fifth generation airway wall area percent.
Get Radiology Tree app to read full this article<
![Figure 1, 3 He magnetic resonance imaging ventilation and computed tomography airway trees in representative ex-smokers with normal (S1–S3) and abnormally elevated ventilation defect percent (VDP) (S4–S6) (airway measurements displayed as wall area percent and lumen area [mm 2 ]) S1 = 70-year-old woman, 12 pack years, forced expiratory volume in 1 second (FEV1) = 93% and VDP = 2%; S2 = 59-year-old woman, 18 pack years, FEV1 = 97% and VDP = 2%; S3 = 51–year-old woman, 20 pack years, FEV1 = 103% and VDP = 4%; S4 = 74–year-old man, 50 pack years, FEV1 = 89% and VDP = 8%; S5 = 79–year-old man, 10 pack years, FEV1 = 88% and VDP = 11%; and S6 = 74–year-old man, 60 pack years, FEV1 = 95% and VDP = 6%.](https://storage.googleapis.com/dl.dentistrykey.com/clinical/VentilationHeterogeneityinExsmokerswithoutAirflowLimitation/0_1s20S1076633215001907.jpg)
Get Radiology Tree app to read full this article<
Get Radiology Tree app to read full this article<
Get Radiology Tree app to read full this article<
Table 2
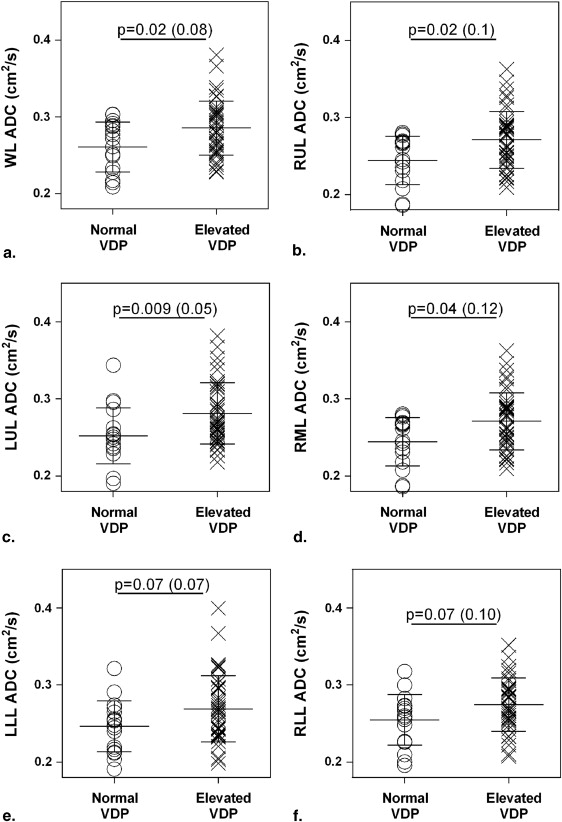
Whole Lung and Regional Measurements for Ex-smokers with Normal and Elevated VDP
Parameter (±SD) Normal VDP (n = 18) Elevated VDP (n = 42)P Value Whole lung WA% ∗ 65 (2) 65 (2) .88 LA, mm 2 ∗ 13 (2) 14 (4) .50 LA/BSA, mm 2 /m 2 ∗ 7 (1) 7 (2) .57 VDP, % 3 (1) 7 (3) <.0001 ADC, cm 2 /s 0.26 (0.03) 0.29 (0.03) .01 RA 950 , % 0.8 (0.5) 1.4 (1.1) .08 Right upper lobe RB1 WA% 62 (2) 61 (4) .29 RB1 LA, mm 2 25 (5) 25 (11) .64 RB1 LA/BSA, mm 2 /m 2 13 (3) 13 (6) .39 VDP, % 3 (2) 5 (4) .02 ADC, cm 2 /s 0.24 (0.03) 0.27 (0.03) .02 RA 950 , % 0.7 (0.6) 1.2 (1.2) .08 Right middle lobe RB5 WA% 63 (4) 62 (4) .25 RB5 LA, mm 2 22 (13) 21 (8) .80 RB5 LA/BSA, mm 2 /m 2 12 (7) 11 (4) .99 VDP, % 6 (9) 9 (10) .04 ADC, cm 2 /s 0.24 (0.03) 0.27 (0.04) .04 RA 950 , % 1.6 (1.0) 2.0 (1.8) .79 Right lower lobe RB8 WA% 62 (3) 62 (3) .43 RB8 LA, mm 2 21 (8) 21 (7) .99 RB8 LA/BSA, mm 2 /m 2 11 (5) 11 (4) .67 VDP, % 5 (3) 8 (6) .02 ADC, cm 2 /s 0.25 (0.03) 0.27 (0.03) .07 RA 950 , % 0.6 (0.4) 1.0 (1.0) .42 Left upper lobe LB1 WA% 63 (3) 63 (3) .52 LB1 LA, mm 2 15 (4) 18 (6) .19 LB1 LA/BSA, mm 2 /m 2 8 (2) 9 (3) .34 VDP, % 4 (4) 8 (8) .02 ADC, cm 2 /s 0.25 (0.03) 0.28 (0.04) .009 RA 950 , % 1.0 (0.6) 1.8 (1.7) .22 Left lower lobe LB8 WA% 59 (4) 60 (4) .68 LB8 LA, mm 2 30 (11) 28 (12) .27 LB8 LA/BSA, mm 2 /m 2 17 (8) 14 (6) .13 VDP, % 3 (1) 7 (3) <.0001 ADC, cm 2 /s 0.25 (0.03) 0.27 (0.04) .07 RA 950 , % 0.7 (0.4) 1.1 (1.1) .42
ADC, 3 He magnetic resonance imaging apparent diffusion coefficient; BSA, body surface area; LA, lumen area; LB1, left upper lobe apical bronchus; LB8, left lower lobe subsegmental bronchus; RA 950 , relative area of the lung parenchyma with attenuation ≤−950 HU; RB1, right upper lobe apical bronchus; RB5, right middle lobe lateral bronchus; RB8, right lower lobe subsegmental bronchus; SD, standard deviation; VDP, 3 He magnetic resonance imaging ventilation defect percent; WA%, wall area percent.
Get Radiology Tree app to read full this article<
Get Radiology Tree app to read full this article<
Get Radiology Tree app to read full this article<
Table 3
Relationship of 3 He MRI VDP with Airways Disease and Emphysema Measurements
Parameter Spearman r__P Value Whole lung VDP WA% ∗ 0.002 .99 LA ∗ 0.04 .76 LA/BSA ∗ −0.04 .75 ADC 0.40 .001 RA 950 0.34 .008 Right upper lobe VDP RB1 WA% 0.24 .06 RB1 LA −0.37 .004 RB1 LA/BSA −0.42 .0008 ADC 0.32 .01 RA 950 0.15 .27 Right middle lobe VDP RB5 WA% −0.11 .40 RB5 LA −0.003 .98 RB5 LA/BSA −0.02 .91 ADC 0.46 .002 RA 950 0.24 .07 Right lower lobe VDP RB8 WA% 0.28 .03 RB8 LA −0.28 .03 RB8 LA/BSA −0.37 .004 ADC 0.38 .003 RA 950 0.21 .11 Left upper lobe VDP LB1 WA% 0.07 .62 LB1 LA 0.13 .33 LB1 LA/BSA −0.01 .94 ADC 0.35 .006 RA 950 0.23 .08 Left lower lobe VDP LB8 WA% 0.04 .73 LB8 LA 0.05 .68 LB8 LA/BSA −0.02 .86 ADC 0.37 .004 RA 950 0.26 .05
ADC, 3 He MRI apparent diffusion coefficient; BSA, body surface area; LA, lumen area; LB1, left upper lobe apical bronchus; LB8, left lower lobe subsegmental bronchus; MRI, magnetic resonance imaging; RA 950 , relative area of the lung parenchyma with attenuation ≤−950 HU; RB1, right upper lobe apical bronchus; RB5, right middle lobe lateral bronchus; RB8, right lower lobe subsegmental bronchus; VDP, 3 He MRI ventilation defect percent; WA%, wall area percent.
Get Radiology Tree app to read full this article<
Get Radiology Tree app to read full this article<
Discussion
Get Radiology Tree app to read full this article<
Get Radiology Tree app to read full this article<
Get Radiology Tree app to read full this article<
Get Radiology Tree app to read full this article<
Get Radiology Tree app to read full this article<
Get Radiology Tree app to read full this article<
Get Radiology Tree app to read full this article<
Acknowledgments
Get Radiology Tree app to read full this article<
Get Radiology Tree app to read full this article<
Supplementary data
Get Radiology Tree app to read full this article<
Supplemental Table 1
Get Radiology Tree app to read full this article<
Get Radiology Tree app to read full this article<
Get Radiology Tree app to read full this article<
Get Radiology Tree app to read full this article<
References
1. Hogg J.C., Chu F., Utokaparch S., et. al.: The nature of small-airway obstruction in chronic obstructive pulmonary disease. The New England journal of medicine 2004; 350: pp. 2645-2653.
2. McDonough J.E., Yuan R., Suzuki M., et. al.: Small-airway obstruction and emphysema in chronic obstructive pulmonary disease. The New England journal of medicine 2011; 365: pp. 1567-1575.
3. Vestbo J., Hurd S.S., Agusti A.G., et. al.: Global strategy for the diagnosis, management, and prevention of chronic obstructive pulmonary disease: GOLD executive summary. American journal of respiratory and critical care medicine 2013; 187: pp. 347-365.
4. van Beek E.J., Dahmen A.M., Stavngaard T., et. al.: Hyperpolarised 3He MRI versus HRCT in COPD and normal volunteers: PHIL trial. The European respiratory journal 2009; 34: pp. 1311-1321.
5. Kirby M., Mathew L., Heydarian M., et. al.: Chronic obstructive pulmonary disease: quantification of bronchodilator effects by using hyperpolarized (3)He MR imaging. Radiology 2011; 261: pp. 283-292.
6. Fain S.B., Gonzalez-Fernandez G., Peterson E.T., et. al.: Evaluation of structure-function relationships in asthma using multidetector CT and hyperpolarized He-3 MRI. Academic radiology 2008; 15: pp. 753-762.
7. Svenningsen S., Kirby M., Starr D., et. al.: What are ventilation defects in asthma?. Thorax 2014; 69: pp. 63-71.
8. Mentore K., Froh D.K., de Lange E.E., et. al.: Hyperpolarized HHe 3 MRI of the lung in cystic fibrosis: assessment at baseline and after bronchodilator and airway clearance treatment 1 . Academic radiology 2005; 12: pp. 1423-1429.
9. Sheikh K., Paulin G.A., Svenningsen S., et. al.: Pulmonary ventilation defects in older never-smokers. J Appl Physiol (1985) 2014; 117: pp. 297-306.
10. Woodhouse N., Wild J.M., Paley M.N., et. al.: Combined helium-3/proton magnetic resonance imaging measurement of ventilated lung volumes in smokers compared to never-smokers. Journal of magnetic resonance imaging : JMRI 2005; 21: pp. 365-369.
11. Wang C., Mugler J.P., de Lange E.E., et. al.: Lung injury induced by secondhand smoke exposure detected with hyperpolarized helium-3 diffusion MR. Journal of magnetic resonance imaging : JMRI 2014; 39: pp. 77-84.
12. Fain S.B., Panth S.R., Evans M.D., et. al.: Early emphysematous changes in asymptomatic smokers: detection with 3He MR imaging. Radiology 2006; 239: pp. 875-883.
13. Kirby M., Pike D., Coxson H.O., et. al.: Hyperpolarized 3He ventilation defects used to predict pulmonary exacerbations in mild to moderate chronic obstructive pulmonary disease. Radiology 2014; pp. 140161.
14. Miller M.R., Hankinson J., Brusasco V., et. al.: Standardisation of spirometry. The European respiratory journal 2005; 26: pp. 319-338.
15. Kirby M., Heydarian M., Svenningsen S., et. al.: Hyperpolarized 3He magnetic resonance functional imaging semiautomated segmentation. Academic radiology 2012; 19: pp. 141-152.
16. Kirby M., Heydarian M., Wheatley A., et. al.: Evaluating bronchodilator effects in chronic obstructive pulmonary disease using diffusion-weighted hyperpolarized helium-3 magnetic resonance imaging. Journal of applied physiology 2012; 112: pp. 651-657.
17. Niimi A., Matsumoto H., Amitani R., et. al.: Airway wall thickness in asthma assessed by computed tomography: relation to clinical indices. American journal of respiratory and critical care medicine 2000; 162: pp. 1518-1523.
18. West J.B.: Respiratory physiology: the essentials.8th ed.2008.Lippincott Williams and Wilkins
19. Wan E.S., Hokanson J.E., Murphy J.R., et. al.: Clinical and radiographic predictors of GOLD-unclassified smokers in the COPDGene study. American journal of respiratory and critical care medicine 2011; 184: pp. 57-63.
20. Coxson H.O., Dirksen A., Edwards L.D., et. al.: The presence and progression of emphysema in COPD as determined by CT scanning and biomarker expression: a prospective analysis from the ECLIPSE study. The lancet Respiratory medicine 2013; 1: pp. 129-136.
21. Yablonskiy D.A., Sukstanskii A.L., Woods J.C., et. al.: Quantification of lung microstructure with hyperpolarized 3He diffusion MRI. Journal of applied physiology 2009; 107: pp. 1258-1265.
22. Evans A., McCormack D., Ouriadov A., et. al.: Anatomical distribution of 3He apparent diffusion coefficients in severe chronic obstructive pulmonary disease. Journal of magnetic resonance imaging : JMRI 2007; 26: pp. 1537-1547.
23. Miller R.R., Muller N.L., Vedal S., et. al.: Limitations of computed tomography in the assessment of emphysema. The American review of respiratory disease 1989; 139: pp. 980-983.
24. Coxson H.O., Leipsic J., Parraga G., et. al.: Using pulmonary imaging to move chronic obstructive pulmonary disease beyond FEV1. American journal of respiratory and critical care medicine 2014; 190: pp. 135-144.
25. Yahaba M., Kawata N., Iesato K., et. al.: The effects of emphysema on airway disease: correlations between multi-detector CT and pulmonary function tests in smokers. European journal of radiology 2014; 83: pp. 1022-1028.
26. Nakano Y., Muro S., Sakai H., et. al.: Computed tomographic measurements of airway dimensions and emphysema in smokers. Correlation with lung function. American journal of respiratory and critical care medicine 2000; 162: pp. 1102-1108.
27. Coxson H.O.: Quantitative chest tomography in COPD research: chairman’s summary. Proceedings of the American Thoracic Society 2008; 5: pp. 874-877.
28. Coxson H.O.: Quantitative computed tomography assessment of airway wall dimensions: current status and potential applications for phenotyping chronic obstructive pulmonary disease. Proceedings of the American Thoracic Society 2008; 5: pp. 940-945.
29. Swift A.J., Wild J.M., Fichele S., et. al.: Emphysematous changes and normal variation in smokers and COPD patients using diffusion 3He MRI. European journal of radiology 2005; 54: pp. 352-358.
30. Fain S.B., Altes T.A., Panth S.R., et. al.: Detection of age-dependent changes in healthy adult lungs with diffusion-weighted 3He MRI. Academic radiology 2005; 12: pp. 1385-1393.
31. Galban C.J., Han M.K., Boes J.L., et. al.: Computed tomography-based biomarker provides unique signature for diagnosis of COPD phenotypes and disease progression. Nature medicine 2012; 18: pp. 1711-1715.