
Rationale and Objectives
Pulmonary functional magnetic resonance imaging provides a way to quantify ventilation and its heterogeneity—a hallmark finding in chronic obstructive pulmonary disease (COPD). Unfortunately, the etiology and physiological meaning of ventilation defects and their relationship to pulmonary function and symptoms in COPD are not well understood. Another biomarker of ventilation heterogeneity is provided by the “poorly communicating fraction” (PCF), and is calculated as the ratio of total lung capacity to alveolar volume made using whole-body plethysmography. Our objective was to compare ventilation heterogeneity using hyperpolarized 3 He magnetic resonance imaging (MRI) and PCF measurements in elderly never-smokers and in ex-smokers with COPD.
Materials and Methods
One hundred forty-six participants (71 ± 8 years, range = 48–87 years) provided written informed consent including 45 elderly never-smokers (71 ± 6 years, range = 61–84 years) and 101 ex-smokers with COPD (71 ± 8 years, range = 48–87 years). During a single 2-hour visit, spirometry, plethysmography, and hyperpolarized 3 He MRI were acquired. The MRI-derived ventilation defect percent (VDP) and plethysmography measurements were acquired and PCF values were calculated. Linear regression, Pearson correlations, and Bland-Altman analysis were used to evaluate the relationships for PCF and MRI VDP.
Results
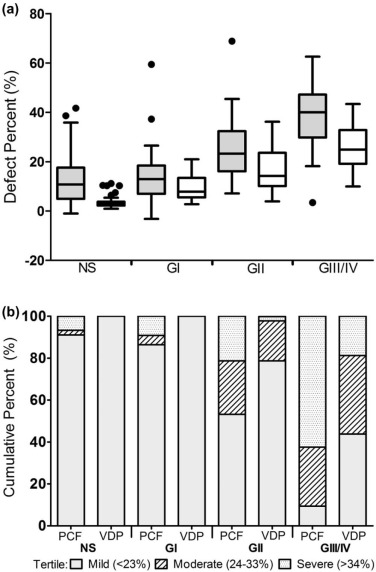
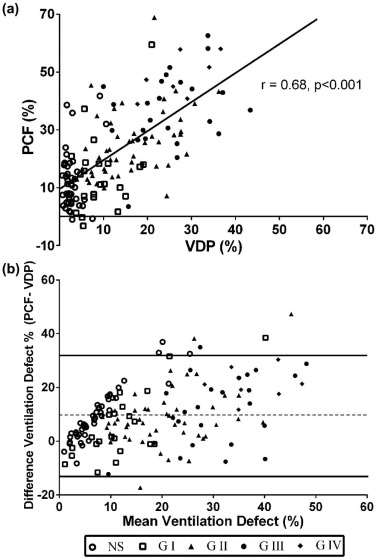
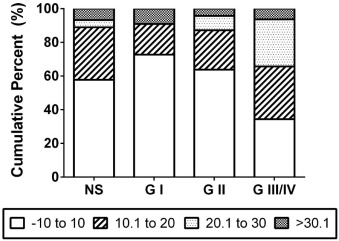
PCF ( P < 0.001) and VDP ( P < 0.001) were significantly increased with increasing COPD severity. There was a significant relationship for VDP and PCF (r = 0.68, P < 0.001) in all subjects and COPD subjects alone (r = 0.61, P < 0.001). Bland-Altman analysis showed that PCF and VDP were significantly different (mean bias = 9.7, upper limit = 32, lower limit = −13, P < 0.001), and in severe-grade COPD, PCF overestimates of VDP were significantly greater.
Conclusions
In elderly never-smokers and in ex-smokers with COPD, PCF and VDP are moderately correlated estimates of COPD ventilation heterogeneity that may be reflecting similar pathophysiology.
Introduction
Chronic obstructive pulmonary disease (COPD) is a major cause of long-term disability and mortality . COPD is recognized as physiologically heterogeneous among patients as well as regionally heterogeneous within individual patients. Patchy ventilation, ventilation heterogeneity, and ventilation defects are hallmark findings in COPD and are believed to represent the abnormally long time constants for lung filling and emptying due to both airways disease and emphysematous bullae . Noninvasive techniques that measure ventilation heterogeneity in COPD patients include multiple-breath nitrogen washout , dual tracer gas single-breath washout to measure the “lung clearance index” , as well as imaging methods that provide visual and quantitative evidence of ventilation and its spatial distribution. Such pulmonary imaging methods include high-resolution X-ray computed tomography , single positron emission tomography , positron emission tomography , and inhaled noble gas magnetic resonance imaging (MRI) .
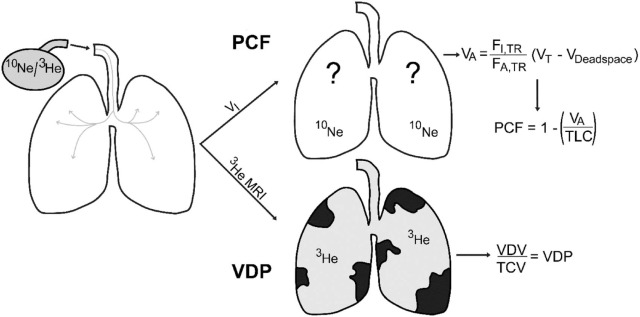
Recently, a novel physiological biomarker of ventilation heterogeneity, the “poorly communicating fraction” (PCF) , was reported and evaluated in COPD patients. As shown in the schematic in Figure 1 , the PCF is generated as the ratio of total lung capacity (TLC) to alveolar volume (V A ) . V A is the volume of gas that ventilates alveoli in each breath and is generated as the ratio of inhaled to exhaled inert tracer gas (He, Ne, CH 4 ) multiplied by the difference of the total inspiratory and dead space volume . Importantly, the PCF was recently shown to predict exercise intolerance in COPD patients , but this measurement has not been directly compared to other measurements of ventilation heterogeneity, including those quantified using imaging.
Get Radiology Tree app to read full this article<
Get Radiology Tree app to read full this article<
Get Radiology Tree app to read full this article<
Methods
Study Subjects
Get Radiology Tree app to read full this article<
Data Acquisition
Get Radiology Tree app to read full this article<
VA=FI,Tr/FA,Tr(VT−Vdeadspace) VA
=
F
I
,
Tr
/
F
A
,
Tr
(
VT
−
Vdeadspace
)
PCF=1−(VA/TLC) PCF
=
1
−
(
VA
/
TLC
)
Get Radiology Tree app to read full this article<
Get Radiology Tree app to read full this article<
Statistical Analysis
Get Radiology Tree app to read full this article<
Get Radiology Tree app to read full this article<
Results
Participant Characteristics
Get Radiology Tree app to read full this article<
Table 1
Demographic and Ventilation Heterogeneity Data
Mean (SD) Never-smokers ( n = 45) Ex-smokers with COPD ( n = 101) Sig. Diff. P Age years [Range] 71 (6) [61–84] 71 (8) [48–87] 1.00 Men n [%] 18 [40] 65 [65] <0.05 BMI [Range] 27 (4) [20–34] 27 (5) [16–37] 0.70 FEV 1 L 2.7 (0.7) 1.7 (0.7) <0.001 FEV 1 % 107 (20) 62 (23) <0.001 FEV 1 /FVC 77 (6) 50 (12) <0.001 DL CO % 87 (18) 54 (20) <0.001 RV % 104 (29) 156 (47) <0.001 FRC % 107 (20) 140 (37) <0.001 TLC % 107 (14) 118 (18) <0.001 V a L 5.4 (1.3) 5.1 (1.3) 0.17 V a % 93 (13) 85 (16) 0.001 PCF % 12 (10) 28 (16) <0.001 VDP % 4 (3) 18 (10) <0.001
Get Radiology Tree app to read full this article<
Ventilation Heterogeneity and COPD Severity
Get Radiology Tree app to read full this article<
Get Radiology Tree app to read full this article<
Get Radiology Tree app to read full this article<
Get Radiology Tree app to read full this article<
Relationships for PCF and MRI Ventilation Heterogeneity
Get Radiology Tree app to read full this article<
Get Radiology Tree app to read full this article<
Discussion
Get Radiology Tree app to read full this article<
PCF and VDP Worsen with Increasing COPD Severity
Get Radiology Tree app to read full this article<
PCF and VDP Are Correlated
Get Radiology Tree app to read full this article<
VDP Underestimates PCF in Severe COPD
Get Radiology Tree app to read full this article<
Limitations
Get Radiology Tree app to read full this article<
Conclusions
Get Radiology Tree app to read full this article<
Acknowledgments
Get Radiology Tree app to read full this article<
References
1. Vestbo J., Hurd S.S., Agusti A.G., et. al.: Global strategy for the diagnosis, management, and prevention of chronic obstructive pulmonary disease: GOLD executive summary. Am J Respir Crit Care Med 2013; 187: pp. 347-365.
2. Ramanna L., Tashkin D.P., Taplin G.V., et. al.: Radioaerosol lung imaging in chronic obstructive pulmonary disease: comparison with pulmonary function tests and roentgenography. Chest 1975; 68: pp. 634-640.
3. Taplin G.V., Tashkin D.P., Chopra S., et. al.: Early detection of chronic obstructive pulmonary disease using radionuclide lung-imaging procedures. Chest 1977; 71: pp. 567-575.
4. Santolicandro A., Ruschi S., Fornai E., et. al.: Imaging of ventilation in chronic obstructive pulmonary disease. J Thorac Imaging 1986; 1: pp. 36-53.
5. Otis A.B., McKerrow C.B., Bartlett R.A., et. al.: Mechanical factors in distribution of pulmonary ventilation. J Appl Physiol 1956; 8: pp. 427-443.
6. Tsoukias N.M., Wilson A.F., George S.C.: Effect of alveolar volume and sequential filling on the diffusing capacity of the lungs: I. theory. Respir Physiol 2000; 120: pp. 231-249.
7. Verbanck S., Schuermans D., Paiva M., et. al.: Small airway function improvement after smoking cessation in smokers without airway obstruction. Am J Respir Crit Care Med 2006; 174: pp. 853-857.
8. Becklake M.R.: A new index of the intrapulmonary mixture of inspired air. Thorax 1952; 7: pp. 111-116.
9. Husemann K., Berg N., Engel J., et. al.: Double tracer gas single-breath washout: reproducibility in healthy subjects and COPD. Eur Respir J 2014; 44: pp. 1210-1222.
10. Park E.A., Goo J.M., Park S.J., et. al.: Chronic obstructive pulmonary disease: quantitative and visual ventilation pattern analysis at xenon ventilation CT performed by using a dual-energy technique. Radiology 2010; 256: pp. 985-997.
11. Guerrero T., Sanders K., Castillo E., et. al.: Dynamic ventilation imaging from four-dimensional computed tomography. Phys Med Biol 2006; 51: pp. 777-791.
12. Suga K., Kawakami Y., Koike H., et. al.: Lung ventilation-perfusion imbalance in pulmonary emphysema: assessment with automated V/Q quotient SPECT. Ann Nucl Med 2010; 24: pp. 269-277.
13. Vidal Melo M.F., Layfield D., Harris R.S., et. al.: Quantification of regional ventilation-perfusion ratios with pet. J Nucl Med 2003; 44: pp. 1982-1991.
14. MacFall J.R., Charles H.C., Black R.D., et. al.: Human lung air spaces: potential for MR imaging with hyperpolarized He-3. Radiology 1996; 200: pp. 553-558.
15. Albert M.S., Cates G.D., Driehuys B., et. al.: Biological magnetic resonance imaging using laser-polarized 129 Xe. Nature 1994; 370: pp. 199-201.
16. Neder J.A., O’Donnell C.D., Cory J., et. al.: Ventilation distribution heterogeneity at rest as a marker of exercise impairment in mild-to-advanced COPD. COPD 2015; 12: pp. 249-256.
17. Macintyre N., Crapo R.O., Viegi G., et. al.: Standardisation of the single-breath determination of carbon monoxide uptake in the lung. Eur Respir J 2005; 26: pp. 720-735.
18. Mathew L., Evans A., Ouriadov A., et. al.: Hyperpolarized 3He magnetic resonance imaging of chronic obstructive pulmonary disease: reproducibility at 3.0 tesla. Acad Radiol 2008; 15: pp. 1298-1311.
19. Kirby M., Heydarian M., Svenningsen S., et. al.: Hyperpolarized 3He magnetic resonance functional imaging semiautomated segmentation. Academic radiology 2012; 19: pp. 141-152.
20. Marshall H., Deppe M.H., Parra-Robles J., et. al.: Direct visualisation of collateral ventilation in COPD with hyperpolarised gas MRI. Thorax 2012; 67: pp. 613-617.
21. Kirby M., Pike D., Coxson H.O., et. al.: Hyperpolarized (3)He ventilation defects used to predict pulmonary exacerbations in mild to moderate chronic obstructive pulmonary disease. Radiology 2014; 273: pp. 887-896.
22. Kirby M., Pike D., McCormack D.G., et. al.: Longitudinal computed tomography and magnetic resonance imaging of COPD: Thoracic Imaging Network of Canada (TINCan) study objectives. J COPD F 2014; 1: pp. 200-211.
23. Miller M.R., Hankinson J., Brusasco V., et. al.: Standardisation of spirometry. Eur Respir J 2005; 26: pp. 319-338.
24. Wanger J., Clausen J.L., Coates A., et. al.: Standardisation of the measurement of lung volumes. Eur Respir J 2005; 26: pp. 511-522.
25. Coates A.L., Graham B.L., McFadden R.G., et. al.: Spirometry in primary care. Can Respir J 2013; 20: pp. 13-21.
26. Woodhouse N., Wild J.M., Paley M.N., et. al.: Combined helium-3/proton magnetic resonance imaging measurement of ventilated lung volumes in smokers compared to never-smokers. J Magn Reson Imaging 2005; 21: pp. 365-369.
27. van Beek E.J., Dahmen A.M., Stavngaard T., et. al.: Hyperpolarised 3He MRI versus HRCT in COPD and normal volunteers: PHIL trial. Eur Respir J 2009; 34: pp. 1311-1321.
28. Stavngaard T., Sogaard L.V., Mortensen J., et. al.: Hyperpolarized 3He MRI and 81mkr SPECT in chronic obstructive pulmonary disease. Eur J Nucl Med Mol Imaging 2005; 32: pp. 448-457.
29. Coxson H.O., Mayo J., Lam S., et. al.: New and current clinical imaging techniques to study chronic obstructive pulmonary disease. Am J Respir Crit Care Med 2009; 180: pp. 588-597.
30. Parraga G., Mathew L., Etemad-Rezai R., et. al.: Hyperpolarized 3He magnetic resonance imaging of ventilation defects in healthy elderly volunteers: initial findings at 3.0 tesla. Academic radiology 2008; 15: pp. 776-785.
31. Mata J., Altes T., Knake J., et. al.: Hyperpolarized 3He MR imaging of the lung: effect of subject immobilization on the occurrence of ventilation defects. Academic radiology 2008; 15: pp. 260-264.
32. Cotton D.J., Prabhu M.B., Mink J.T., et. al.: Effect of ventilation inhomogeneity on “intrabreath” measurements of diffusing capacity in normal subjects. J Appl Physiol 1993; 75: pp. 927-932.
33. Prediletto R., Fornai E., Catapano G., et. al.: Assessment of the alveolar volume when sampling exhaled gas at different expired volumes in the single breath diffusion test. BMC Pulm Med 2007; 7: pp. 18.
34. Morris M.J., Madgwick R.G., Collyer I., et. al.: Analysis of expiratory tidal flow patterns as a diagnostic tool in airflow obstruction. Eur Respir J 1998; 12: pp. 1113-1117.
35. Chen X.J., Moller H.E., Chawla M.S., et. al.: Spatially resolved measurements of hyperpolarized gas properties in the lung in vivo. Part I: diffusion coefficient. Magn Reson Med 1999; 42: pp. 721-728.
36. Kirby M., Svenningsen S., Owrangi A., et. al.: Hyperpolarized 3He and 129Xe MR imaging in healthy volunteers and patients with chronic obstructive pulmonary disease. Radiology 2012; 265: pp. 600-610.
37. Mohsenifar Z., Ross M.D., Waxman A., et. al.: Changes in distribution of lung perfusion and ventilation at rest and during maximal exercise. Chest 1985; 87: pp. 359-362.
38. Leith D., Brown R.: Human lung volumes and the mechanisms that set them. Eur Respir J 1999; 13: pp. 468-472.
39. O’Donnell D.E., Laveneziana P.: Physiology and consequences of lung hyperinflation in COPD. Eur Respir Rev 2006; 15: pp. 61-67.
40. Cooper C.B.: The connection between chronic obstructive pulmonary disease symptoms and hyperinflation and its impact on exercise and function. Am J Med 2006; 119: pp. 21-31.
41. Lee J.S., Kim S.O., Seo J.B., et. al.: Longitudinal lung volume changes in patients with chronic obstructive pulmonary disease. Lung 2013; 191: pp. 405-412.
42. O’Donnell D.E., D’Arsigny C., Fitzpatrick M., et. al.: Exercise hypercapnia in advanced chronic obstructive pulmonary disease: the role of lung hyperinflation. Am J Respir Crit Care Med 2002; 166: pp. 663-668.
43. Bourbeau J., Tan W.C., Benedetti A., et. al.: Canadian Cohort Obstructive Lung Disease (CANCold): fulfilling the need for longitudinal observational studies in COPD. COPD 2014; 11: pp. 125-132.
44. Couper D., LaVange L.M., Han M., et. al.: Design of the Subpopulations and Intermediate Outcomes in COPD Study (SPIROMICS). Thorax 2014; 69: pp. 492-495.
45. Vestbo J., Anderson W., Coxson H.O., et. al.: Evaluation of COPD longitudinally to identify predictive surrogate end-points (ECLIPSE). Eur Respir J 2008; 31: pp. 869-873.
46. Regan E.A., Hokanson J.E., Murphy J.R., et. al.: Genetic epidemiology of COPD (COPDGene) study design. COPD 2010; 7: pp. 32-43.