
Rationale and Objectives
Imaging-based assessment of cardiovascular structure and function provides clinically relevant information in smokers. Non-cardiac-gated thoracic computed tomographic (CT) scanning is increasingly leveraged for clinical care and lung cancer screening. We sought to determine if more comprehensive measures of ventricular geometry could be obtained from CT using an atlas-based surface model of the heart.
Materials and Methods
Subcohorts of 24 subjects with cardiac magnetic resonance imaging (MRI) and 262 subjects with echocardiography were identified from COPDGene, a longitudinal observational study of smokers. A surface model of the heart was manually initialized, and then automatically optimized to fit the epicardium for each CT. Estimates of right and left ventricular (RV and LV) volume and free-wall curvature were then calculated and compared to structural and functional metrics obtained from MRI and echocardiograms.
Results
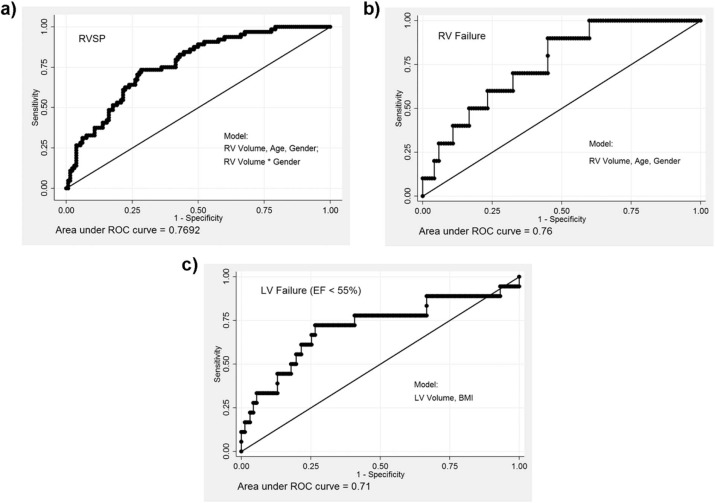
CT measures of RV dimension and curvature correlated with similar measures obtained using MRI. RV and LV volume obtained from CT inversely correlated with echocardiogram-based estimates of RV systolic pressure using tricuspid regurgitation jet velocity and LV ejection fraction respectively. Patients with evidence of RV or LV dysfunction on echocardiogram had larger RV and LV dimensions on CT. Logistic regression models based on demographics and ventricular measures from CT had an area under the curve of >0.7 for the prediction of elevated right ventricular systolic pressure and ventricular failure.
Conclusions
These data suggest that non-cardiac-gated, non-contrast-enhanced thoracic CT scanning may provide insight into cardiac structure and function in smokers.
Introduction
Cardiovascular disease is a major cause of morbidity in smokers, and as much as 50% of the estimated 24 million patients in the United States with chronic obstructive pulmonary disease (COPD) die of cardiovascular causes . Although echocardiography and cardiac magnetic resonance imaging (MRI) are often used to study cardiac structure and function in COPD , these are not routinely deployed in all smokers. Computed tomographic (CT) imaging of the chest is broadly used in clinical care and is increasingly used for lung cancer screening in high-risk smokers . Assessment of cardiac structure on those CT scans may help identify patients with COPD at greater risk of developing cardiac dysfunction. Rapid, noninvasive assessments of cardiac morphology and a better understanding of the functional interdependence of heart and lung may improve healthcare outcomes through early detection and initiation of treatment.
CT has been used to quantify coronary and thoracic aortic calcification , study the size of the pulmonary artery and aorta , and describe the relationship between pulmonary vascular and parenchymal disease progression . The caliber of other vessels such as the pulmonary veins has been explored as an image-based metric of volume status .
Get Radiology Tree app to read full this article<
Get Radiology Tree app to read full this article<
Methods
COPDGene Study
Get Radiology Tree app to read full this article<
Cardiac MRI Cohort
Get Radiology Tree app to read full this article<
Echocardiography Cohort
Get Radiology Tree app to read full this article<
Cardiac Modeling
Get Radiology Tree app to read full this article<
Get Radiology Tree app to read full this article<
Get Radiology Tree app to read full this article<
Get Radiology Tree app to read full this article<
Sphericity=π13(6V)23S Sphericity
=
π
1
3
(
6
V
)
2
3
S
where V is the volume and S is the surface area of the ventricle. The free wall was defined as the surface segments not in contact with the septum. The curvature estimate was defined as
Curvature=(κ12+κ22)2−−−−−−−√ Curvature
=
(
κ
1
2
+
κ
2
2
)
2
where κ1 κ
1 is the minimum and κ2 κ
2 is the maximum curvature of the surface .
Get Radiology Tree app to read full this article<
Statistical Analysis
Get Radiology Tree app to read full this article<
Results
Reproducibility of CT-based Measures of Ventricular Geometry
Get Radiology Tree app to read full this article<
TABLE 1
Demographics of Two Cohorts Used in This Study, Both Subsets of the COPDGene Study
Variable (A) (B) (C) Dual Enrollment MRI Cohort ECHO Cohort ( N = 11) ( N = 24) ( N = 262) Demographics Age (y) 52 ± 8 59 ± 9 65 ± 9 White race 10(91%) 14(58%) 250(95%) Male sex 11(100%) 16(67%) 126(48%) BMI 29 ± 9 29 ± 8 28 ± 7 BSA (m 2 ) 2.06 ± 0.25 1.99 ± 0.22 1.93 ± .28 6-minute walk distance (ft) 1105 ± 552 1069 ± 209 1173 ± 365 Lung function FEV 1 % predicted 70 ± 22 57 ± 27 47 ± 23 FEV 1 -to-FVC ratio 0.68 ± 0.17 0.52 ± 0.16 0.46 ± 0.17 TLCpp
(Race adjusted, L) 76 ± 20 102 ± 14 106 ± 19 ( N = 257) MRI LVEF (%) 64 ± 8 RVEF (%) 58 ± 10 RVESVI 24 ± 9 RVMI 13 ± 4 ECHO RV minor axis 3.24 ± 0.54 ( N = 238) RVSP 36.0 ± 13.22 LVEF (%) 64.1 ± 7.7
BMI, body mass index; BSA, estimated body surface area; COPDGene, Genetic Epidemiology of COPD; FEV 1 , forced expiratory volume in 1 second; FVC, forced vital capacity; LVEF, left ventricular ejection fraction; MRI, magnetic resonance imaging; RVEF, right ventricular ejection fraction; RVESVI, right ventricular end systolic volume index; RVMI, right ventricular mass index; TLCpp, total lung capacity, percent predicted.
Data were presented as n (%) and mean (±standard deviation).
Get Radiology Tree app to read full this article<
Get Radiology Tree app to read full this article<
Validation of CT-based Ventricular Geometry as Compared to MRI Measures
Get Radiology Tree app to read full this article<
TABLE 2
Correlation Coefficient ( R ) Between CT-derived Cardiac Volume Measurements and Cardiac MRI-based Volume and Mass Estimates in 24 Subjects
Cardiac MRI-derived Metrics CT-derived Metrics RV ED Volume MR RV ED Mass MR RV_EPI Volume CT 0.65 (.0006) 0.60 (.002) RV_ENDO Volume CT 0.61 (.001) 0.57 (.004) LV ED volume MR LV ED mass MR LV_EPI volume CT 0.61 (.001) 0.56 (.004) LV_ENDO volume CT 0.60 (.002) 0.51 (.01) LV ED length MR LV Long Axis CT 0.49 (.02) LV mid ED curvature MR LV Free Wall curvature CT 0.70 (.0001) LV ED radius ratio MR LV sphericity CT 0.51 (.01) RV/LV ED volume ratio MR RV/LV volume ratio CT 0.46 (.02)
CT, computed tomographic; ED, end diastolic; LV, left ventricular; MID, middle of ventricle; MRI, magnetic resonance imaging; RV, right ventricular.
Spearman correlation coefficients, with accompanying P values.
Get Radiology Tree app to read full this article<
Association Between CT-based Ventricular Geometry and Echocardiographic-based Ventricular Structure and Function
Get Radiology Tree app to read full this article<
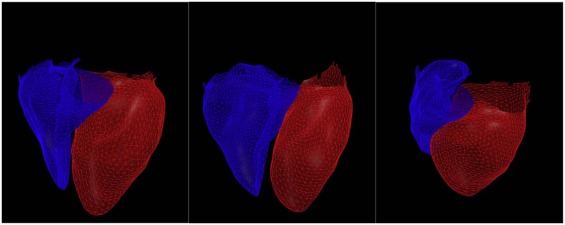
TABLE 3
Correlation of CT-derived Right Ventricular Geometry With Echocardiogram-derived Geometric and Functional Measures (First Three Columns) and the Difference in Those Metrics Between Patients Characterized as Having Abnormal Versus Patients Having Normal RV Function
CT-derived Measures of Right Ventricle Echocardiogram-derived Measures RV Minor Axis ECHO RVSP Decreased RV Function Normal RV Function_P_ ( N = 238) ( N = 194) ( N = 10) ( N = 120) RV Long Axis CT R = 0.36,R = 0.28, 7.3[6.1–7.5] 6.9[6.4–7.3] .44P < .0001P < .0001 RV short Axis CT R = 0.44,R = 0.27, 4.3[4.0–4.7] 4.0[3.6–4.3] .03P < .0001P = .0002 RV_EPI volume CT R = 0.46,R = 0.3, 106[87–117] 85[66–103] .04P < .0001P < .0001 RV_ENDO volume CT R = 0.45R = 0.28 67[54–79] 57[42–67] .06P < .0001P = .0001 RV surface area CT R = 0.49,R = 0.24, 169[142–194] 148[130–169] .05P < .0001P = .0006
CT, computed tomographic; RA, right atrium; RV, right ventricle; RVSP, estimated right ventricular systolic pressure by echocardiogram.
Values shown are Spearman correlation coefficients ( R ) and P values associated with Spearman correlation. Values shown for subgroups with decreased and normal RV function are shown as median [interquartile range].
Get Radiology Tree app to read full this article<
Get Radiology Tree app to read full this article<
TABLE 4
Correlation of CT-derived Left Ventricular Geometry With Echocardiogram-derived Functional Measures (First Three Columns) and the Difference in Those Metrics Between Patients Characterized as Having Abnormal Versus Patients Having Normal Left Ventricular Ejection Fraction
CT Measures of Left Ventricle ECHO-derived Measures LVEF Reduced EF Normal EF_P_ Value ( N = 98) ( N = 18) ( N = 162) LV Long Axis CT R = −0.20, P = .05 8.54[7.69–9.21] 8.05[7.42–8.62] .08 LV_EPI volume CT R = −0.22, P = .03 207.1[167.5–240.1] 173.1[143.8–199.2] .01 LV_ENDO volume CT R = −0.23, P = .03 118.0[89.0–141.1] 97.1[78.4–111.6] .02 LV surface area CT R = −0.21, P = .03 202.7[164.1–223.7] 176.6[153.1–197.0] .03 LV volume/surface Area CT R = −0.18, P = .08 1.03[0.98–1.07] 0.97[0.92–1.02] .009 LV Free-Wall Curvature CT R = 0.20, P = .04 0.018[0.0169–0.0195] 0.0192[0.18-0.0205] .03
EF, ejection fraction; LV, left ventricle.
Values shown are correlation coefficients ( R ) and P values associated with Spearman correlation. Values shown for subgroups with decreased and normal ejection fraction are shown as median [interquartile range].
Get Radiology Tree app to read full this article<
Get Radiology Tree app to read full this article<
TABLE 5
Logistic Regression Model Performance Based on AUC (Area Under the Curve) for Models Predicting RVSP >40, Reduced RV Function, Reduced LV Ejection Fraction, and History of CHF
Model Variables RVSP >40 RVF Reduced LVEF_N_ = 194N = 130N = 180 (64/194) (10/130) (18/180) AUC AUC Model Variables AUC RVV 0.67 0.70 LVV 0.68 RVV+Age+Gender 0.75 0.75 LVV+BMI 0.71 RVV+Age+Gender+RVV*Gender 0.77
LV, left ventricle; LVEF, left ventricular ejection fraction; LVV, left ventricle volume; RV, right ventricle; RVF, evidence of RV failure on echocardiogram; RVSP, estimated right ventricular systolic pressures by echocardiogram; RVV, right ventricle volume.
Get Radiology Tree app to read full this article<
Discussion
Get Radiology Tree app to read full this article<
Get Radiology Tree app to read full this article<
Get Radiology Tree app to read full this article<
Get Radiology Tree app to read full this article<
Get Radiology Tree app to read full this article<
Get Radiology Tree app to read full this article<
Appendix
Supplementary Data
Get Radiology Tree app to read full this article<
Table S1
Get Radiology Tree app to read full this article<
Get Radiology Tree app to read full this article<
Get Radiology Tree app to read full this article<
Table S2
Get Radiology Tree app to read full this article<
Get Radiology Tree app to read full this article<
Get Radiology Tree app to read full this article<
Appendix S1
Get Radiology Tree app to read full this article<
Get Radiology Tree app to read full this article<
Get Radiology Tree app to read full this article<
Get Radiology Tree app to read full this article<
Get Radiology Tree app to read full this article<
References
1. Divo M., Cote C., de Torres J.P., et. al.: Comorbidities and risk of mortality in patients with chronic obstructive pulmonary disease. Am J Respir Crit Care Med 2012; 186: pp. 155-161.
2. Sin D.D., Man S.F.: Chronic obstructive pulmonary disease as a risk factor for cardiovascular morbidity and mortality. Proc Am Thorac Soc 2005; 2: pp. 8-11.
3. Rahaghi F.N., van Beek E.J., Washko G.R.: Cardiopulmonary coupling in chronic obstructive pulmonary disease: the role of imaging. J Thorac Imaging 2014; 29: pp. 80-91.
4. Eberth J.M.: Lung cancer screening with low-dose CT in the United States. J Am Coll Radiol 2015; 12: pp. 1395-1402.
5. Budoff M.J., Nasir K., Kinney G.L., et. al.: Coronary artery and thoracic calcium on noncontrast thoracic CT scans: comparison of ungated and gated examinations in patients from the COPD Gene cohort. J Cardiovasc Comput Tomogr 2011; 5: pp. 113-118.
6. Wells J.M., Washko G.R., Han M.K., et. al.: Pulmonary arterial enlargement and acute exacerbations of COPD. N Engl J Med 2012; 367: pp. 913-921.
7. Ng C.S., Wells A.U., Padley S.P.: A CT sign of chronic pulmonary arterial hypertension: the ratio of main pulmonary artery to aortic diameter. J Thorac Imaging 1999; 14: pp. 270-278.
8. Kurugol S., Come C.E., Diaz A.A., et. al.: Automated quantitative 3D analysis of aorta size, morphology, and mural calcification distributions. Med Phys 2015; 42: pp. 5467-5478.
9. Matsuoka S., Washko G.R., Yamashiro T., et. al.: Pulmonary hypertension and computed tomography measurement of small pulmonary vessels in severe emphysema. Am J Respir Crit Care Med 2010; 181: pp. 218-225.
10. Estepar R.S., Kinney G.L., Black-Shinn J.L., et. al.: Computed tomographic measures of pulmonary vascular morphology in smokers and their clinical implications. Am J Respir Crit Care Med 2013; 188: pp. 231-239.
11. Smith B.M., Prince M.R., Hoffman E.A., et. al.: Impaired left ventricular filling in COPD and emphysema: is it the heart or the lungs? The Multi-Ethnic Study of Atherosclerosis COPD Study. Chest 2013; 144: pp. 1143-1151.
12. Lu M.T., Cai T., Ersoy H., et. al.: Comparison of ECG-gated versus non-gated CT ventricular measurements in thirty patients with acute pulmonary embolism. Int J Cardiovasc Imaging 2009; 25: pp. 101-107.
13. Haak A., Ren B., Mulder H.W., et. al.: Improved segmentation of multiple cavities of the heart in wide-view 3-D transesophageal echocardiograms. Ultrasound Med Biol 2015; 41: pp. 1991-2000.
14. Haak A.M., Mulder H.W., Ren B., et. al.: Segmentation of multiple heart cavities in wide-view fused 3D transesophageal echocardiograms.Ultrasonics symposium (IUS), 2014 IEEE international.2014.pp. 691-694.
15. Regan E.A., Hokanson J.E., Murphy J.R., et. al.: Genetic epidemiology of COPD (COPDGene) study design. COPD 2010; 7: pp. 32-43.
16. Wells J.M., Iyer A.S., Rahaghi F.N., et. al.: Pulmonary artery enlargement is associated with right ventricular dysfunction and loss of blood volume in small pulmonary vessels in chronic obstructive pulmonary disease. Circ Cardiovasc Imaging 2015; 8:
17. Hoogendoorn C., Duchateau N., Sanchez-Quintana D., et. al.: A high-resolution atlas and statistical model of the human heart from multislice CT. IEEE Trans Med Imaging 2013; 32: pp. 28-44.
18. Vegas-Sanchez-Ferrero G., Aja-Fernandez S., Palencia C., et. al.: A generalized gamma mixture model for ultrasonic tissue characterization. Comput Math Methods Med 2012; 2012: 481923
19. Vegas-Sanchez-Ferrero G., Seabra J., Rodriguez-Leor O., et. al.: Gamma mixture classifier for plaque detection in intravascular ultrasonic images. IEEE Trans Ultrason Ferroelectr Freq Control 2014; 61: pp. 44-61.
20. Koenderink J.J., van Doorn A.J.: Surface shape and curvature scales. Image Vis Comput 1992; 10: pp. 557-564.
21. Lin L.I.: A concordance correlation coefficient to evaluate reproducibility. Biometrics 1989; 45: pp. 255-268.
22. Hosmer D.W.Lemeshow S.Sturdivant R.X.Applied logistic regression.2013.John Wiley & Sons, Inc.New Jersey: