
Rationale and Objectives
To evaluate two- and three-dimensional (2D and 3D) image quality of sub-milliSievert (mSv) computed tomography (CT) colonography utilizing a third-generation dual source CT scanner featuring a tin filter.
Methods
We retrospectively evaluated 26 consecutive patients who underwent third-generation dual source CT colonography, nine with the standard-dose clinical-scan protocol (SDP) and 17 with a low-dose protocol (LDP) featuring a tin filter. Radiation dose was evaluated by volume computed tomography dose index (CTDI vol ), dose length product (DLP), effective dose (E), and size-specific dose estimate. Objective image quality was evaluated utilizing signal-to-noise ratio (SNR) derived from standardized placed regions of interest on the transverse 2D images and the ratio of SNR/ CTDIvol−−−−−−−√ C
T
D
I
v
o
l (normalized SNR). Two radiologists in consensus assessed subjective image quality of the virtual 3D images.
Results
There were no significant differences in subjective image quality ( P = .661). All examinations were rated “excellent” or “good” for diagnostic confidence. The mean total for DLP/E was 143.4 ± 29.8 mGy/3.00 ± 0.40 mSv in the SDP and therefore significantly higher than in the LDP with 36.9 ± 8.7 mGy/0.75 ± 0.16 mSv ( P < .001). The SNR was 8.9 ± 2.1 in the SDP and 4.9 ± 0.8 in the LDP.
Conclusions
Third-generation dual source CT featuring a tin filter enables consistent sub-mSv colonography without substantially impairing image quality.
Introduction
Colorectal cancer is the second most common cancer in Europe and the third most common in the United States . Screening colonoscopy procedures have led to a reduction of colorectal cancer incidence in Germany of 11%–19% despite relatively low screening participation . Nevertheless, there is the risk of complications, for example, perforations and therefore hospitalization and higher morbidity. Older patients in particular are six times more likely to experience complications . Furthermore, an analysis of 3.8 million screening examinations found that women age 70 years and older in particular must be indicated carefully to conventional colonoscopy, as the benefit-risk profile between the detection of a T2 carcinoma is outweighed by the risk of procedural complications, such as bleeding, cardiopulmonary incidents, and perforations . Although computed tomography (CT) colonography has proven to be a valuable and less invasive screening method with comparable accuracy to optical colonoscopy for polyps larger than 1 cm, it is not recommended in guidelines on colorectal cancer, including the German S3 Leitlinie, because of ionizing radiation concerns . However, especially in elderly patients, the potential benefits of CT colonography drastically outweigh the radiation risks . To reduce patients’ effective dose (E) as much as possible, continuous efforts with different approaches, such as implementing iterative reconstructions, modulations in tube current and voltage, and automated dose modulation techniques, are necessary .
It is evident that tin filtration enables significant dose reduction in CT examinations with good image quality . However, to our knowledge, no work has been published concerning tin filtration in CT colonography. Therefore, the aim of this study is to evaluate the radiation dose and image quality of sub-milliSievert (sub-mSv) CT colonography utilizing third-generation dual source CT featuring a tin filter.
Materials and Methods
Get Radiology Tree app to read full this article<
Patient Population
Get Radiology Tree app to read full this article<
TABLE 1
Patient Characteristics for the Standard-Dose and Low-Dose Patient Cohort
Standard Protocol Low Dose_P_ Value Age (years) 58.7 ± 11.9 61.9 ± 10.2 .476 Sex 1 m/8 f 8 m/9 f .098 Diameter (cm) 53.7 ± 6.2 55.4 ± 2.9 .348
f, female; m, male.
Patient diameter (summation of the anteroposterior and lateral diameter) is used to calculate the size-specific dose estimation, as strongly recommended by the American Association of Physicists in Medicine. There are no significant differences between the groups.
Get Radiology Tree app to read full this article<
Patient Preparation and Examination Technique
Get Radiology Tree app to read full this article<
Get Radiology Tree app to read full this article<
Get Radiology Tree app to read full this article<
Get Radiology Tree app to read full this article<
Get Radiology Tree app to read full this article<
Objective Image Quality Assessment
Get Radiology Tree app to read full this article<
Get Radiology Tree app to read full this article<
Subjective Image Quality Assessment
Get Radiology Tree app to read full this article<
Radiation Exposure
Get Radiology Tree app to read full this article<
Statistical Analysis
Get Radiology Tree app to read full this article<
Results
Get Radiology Tree app to read full this article<
![Figure 1, Computed tomography (CT) colonographies of three patients, each in one line. The 2D images from the supine position scan (CT images) are displayed with their corresponding virtual three-dimensional (3D) image at the level of the ileocecal valve ( left ) and the rectum ( right ) in each patient. (a) Standard-dose protocol (total dose length product [DLP] 164 mGy × cm) resulted in a Likert score of 1 for all four images. (b) Low-dose protocol (total DLP 31 mGy × cm), as well with a Likert score of 1 for all four images. (c) Low-dose protocol in a patient with an artificial hip (total DLP 33 mGy × cm). The beam hardening artifacts are clearly visible and project themselves onto the rectal wall. However, as these artifacts are in a slightly different position in the prone position scan (not illustrated), they do not influence detection. The virtual 3D image at the level of the rectal catheter displays a slightly increased (Likert score 2) rippling of the rectal surface because of the increased image noise.](https://storage.googleapis.com/dl.dentistrykey.com/clinical/VirtualComputedTomographyColonography/0_1s20S107663321730524X.jpg)
Get Radiology Tree app to read full this article<
Get Radiology Tree app to read full this article<
Get Radiology Tree app to read full this article<
Get Radiology Tree app to read full this article<
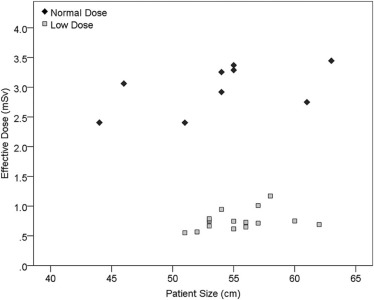
![Figure 2, Effective dose of the four scans (two topograms, and prone and supine scan) and their sum. The dose for both topograms was approximately equal and combined for improved visibility. The total dose of the standard-dose protocol is significantly higher than that of the low-dose protocol. Interestingly, the topogram deposited by the vendor in the low-dose protocol did not include a tin filtration, and because of altered tube current and voltage, demonstrated a slightly higher dose than the topogram of the standard-dose protocol (computed tomography dose index [CTDI vol ] 0.10 mGy vs 0.07 mGy). Furthermore, the combined dose of the two topograms without tin filtration is even higher than the low-dose spiral CT scan in prone position featuring tin filtration, leaving room for further dose reduction.](https://storage.googleapis.com/dl.dentistrykey.com/clinical/VirtualComputedTomographyColonography/1_1s20S107663321730524X.jpg)
Get Radiology Tree app to read full this article<
Get Radiology Tree app to read full this article<
Get Radiology Tree app to read full this article<
Get Radiology Tree app to read full this article<
Get Radiology Tree app to read full this article<
TABLE 2
Detailed Experimental Results
Standard Protocol Low-dose Protocol_P_ Value Scan length (cm) 45.0 ± 2.5 47.0 ± 3.1 .102 CTDI vol (mGy) Topogram Supine 0.07 ± 0.00 0.10 ± 0.00 <.001 † Prone 0.07 ± 0.00 0.10 ± 0.00 <.001 † Scan Supine 1.95 ± 0.42 0.37 ± 0.10 <.001 † Prone 1.07 ± 0.25 0.21 ± 0.06 <.001 † DLP (mGy × cm) Topogram Supine 3.57 ± 0.16 4.88 ± 0.28 <.001 † Prone 3.68 ± 0.15 4.84 ± 0.42 <.001 † Scan Supine 87.4 ± 18.0 17.7 ± 5.24 <.001 † Prone 48.6 ± 12.6 9.38 ± 3.10 <.001 † Total 143.4 ± 29.8 36.9 ± 8.7 <.001 † SSDE 199.2 ± 26.5 50.1 ± 10.6 <.001 † Effective dose (mSv) 3.00 ± 0.40 0.75 ± 0.16 <.001 † Density in scan prone (HU) Liver 57.6 ± 4.5 59.8 ± 5.5 .297 M. gluteus medius 45.3 ± 5.4 46.0 ± 6.0 .784 Noise in air in scan prone (HU) 6.1 ± 1.8 10.9 ± 1.5 <.001 † Signal to noise tatio (SNR) 8.9 ± 2.1 4.9 ± 0.8 <.001 † normalized SNR (SNRn) = SNR/ CTDIvol−−−−−−−√ C
T
D
I
v
o
l (1/ mGy*cm−−−−−−−−√ m
G
y
*
c
m ) 5.25 ± 1.48 6.60 ± 1.36 .029 *
CTDI vol , computed tomography dose index; DLP, dose length product; HU, Hounsfield Unit; SNR, signal-to-noise ratio; SNRn, normalized SNR.
Differences of radiation exposure and objective image quality assessments are compared for the standard-dose protocol and low-dose protocol, including P values.
A significant difference is indicated by ( P < 0.05) or ( P < 0.001).
Get Radiology Tree app to read full this article<
Discussion
Get Radiology Tree app to read full this article<
Get Radiology Tree app to read full this article<
Get Radiology Tree app to read full this article<
Get Radiology Tree app to read full this article<
Get Radiology Tree app to read full this article<
Get Radiology Tree app to read full this article<
Conclusions
Get Radiology Tree app to read full this article<
Acknowledgments
Get Radiology Tree app to read full this article<
Get Radiology Tree app to read full this article<
References
1. Siegel R., Naishadham D., Jemal A.: Cancer statistics, 2012. CA Cancer J Clin 2012; 62: pp. 10-29.
2. Ferlay J., Soerjomataram I., Dikshit R., et. al.: Cancer incidence and mortality worldwide: sources, methods and major patterns in GLOBOCAN 2012. Int J Cancer 2015; 136: pp. E359-E386.
3. Brenner H., Hoffmeister M., Brenner G., et. al.: Expected reduction of colorectal cancer incidence within 8 years after introduction of the German screening colonoscopy programme: estimates based on 1,875,708 screening colonoscopies. Eur J Cancer 2009; 45: pp. 2027-2033.
4. Lohsiriwat V., Sujarittanakarn S., Akaraviputh T., et. al.: What are the risk factors of colonoscopic perforation?. BMC Gastroenterol 2009; 9: pp. 71.
5. Schäfer M., Altenhofen L., Stillfried D.: Darmkrebsprävention: Teilnahmeraten stagnieren—mehr Information erforderlich. Dtsch Arztebl Int 2012; 109: pp. A-528-A-530.
6. Pickhardt P.J., Choi J.R., Hwang I., et. al.: Computed tomographic virtual colonoscopy to screen for colorectal neoplasia in asymptomatic adults. N Engl J Med 2003; 349: pp. 2191-2200.
7. Johnson C.D., Chen M.H., Toledano A.Y., et. al.: Accuracy of CT colonography for detection of large adenomas and cancers. N Engl J Med 2008; 359: pp. 1207-1217.
8. Graser A., Stieber P., Nagel D., et. al.: Comparison of CT colonography, colonoscopy, sigmoidoscopy and faecal occult blood tests for the detection of advanced adenoma in an average risk population. Gut 2009; 58: pp. 241-248.
9. AWMF-Leitlinie : S3—Leitlinie Deutschland: “Kolorektales Karzinom”, Registernummer 021/007OL Stand: Nov 2017. Available at http://www.awmf.org/uploads/tx_szleitlinien/021-007OLl_S3_KRK_2017-12_1.pdf
10. Bongartz G., Golding S.J., Jurik A.G., et. al.: Radiation-related cancer risks from CT colonography screening: a risk-benefit analysis. AJR Am J Roentgenol 2011; 196: pp. 816-823.
11. Lubner M.G., Pooler B.D., Kitchin D.R., et. al.: Sub-milliSievert (sub-mSv) CT colonography: a prospective comparison of image quality and polyp conspicuity at reduced-dose versus standard-dose imaging. Eur Radiol 2015; 25: pp. 2089-2102.
12. Chang K.J., Yee J.: Dose reduction methods for CT colonography. Abdom Imaging 2013; 38: pp. 224-232.
13. Lell M.M., May M.S., Brand M., et. al.: Imaging the parasinus region with a third-generation dual-source CT and the effect of tin filtration on image quality and radiation dose. AJNR Am J Neuroradiol 2015; 36: pp. 1225-1230.
14. Brady S.L., Kaufman R.A.: Investigation of American Association of Physicists in Medicine Report 204 size-specific dose estimates for pediatric CT implementation. Radiology 2012; 265: pp. 832-840.
15. Hausmann P., Stenger A., Dittrich S., et. al.: Application of dual-source-computed tomography in pediatric cardiology in children within the first year of life. Rofo 2016; 188: pp. 179-187.
16. Kramer M., Ellmann S., Allmendinger T., et. al.: Computed tomography angiography of carotid arteries and vertebrobasilar system: a simulation study for radiation dose reduction. Medicine (Baltimore) 2015; 94: pp. e1058.
17. Uhrig M., Simons D., Kachelriess M., et. al.: Advanced abdominal imaging with dual energy CT is feasible without increasing radiation dose. Cancer Imaging 2016; 16: pp. 15.
18. Bongartz G., Golding S.J., Jurik A.G., et. al.: European Guidelines for Multislice Computed Tomography—Funded by the European Commission—Contract number FIGM-CT2000-20078-CT-TIP. Available at http://www.drs.dk/guidelines/ct/quality/index.htm
19. Braun F.M., Johnson T.R., Sommer W.H., et. al.: Chest CT using spectral filtration: radiation dose, image quality, and spectrum of clinical utility. Eur Radiol 2015; 25: pp. 1598-1606.
20. Ginsburg M., Obara P., Wise L., et. al.: BMI-based radiation dose reduction in CT colonography. Acad Radiol 2013; 20: pp. 486-492.
21. Chang K.J., Caovan D.B., Grand D.J., et. al.: Reducing radiation dose at CT colonography: decreasing tube voltage to 100 kVp. Radiology 2013; 266: pp. 791-800.
22. Tulum G., Bolat B., Osman O.: A CAD of fully automated colonic polyp detection for contrasted and non-contrasted CT scans. Int J Comput Assist Radiol Surg 2017; 12: pp. 627-644.
23. Gordic S., Morsbach F., Schmidt B., et. al.: Ultralow-dose chest computed tomography for pulmonary nodule detection: first performance evaluation of single energy scanning with spectral shaping. Invest Radiol 2014; 49: pp. 465-473.