
Rationale and Objectives
The aim of this study was to evaluate the suitability of 3-T magnetic resonance imaging (MRI) for olfactory bulb volumetry, comparing image quality obtained using different sequences on the basis of physical characteristics in combination with observer performance.
Materials and Methods
Twenty-two healthy volunteers (11 men, 11 women; mean age, 25 years) underwent 3-T MRI of the frontal skull base in this prospective study. Imaging was performed using a constructive interference in steady state (CISS) three-dimensional Fourier transformation sequence, a three-dimensional T2-weighted (3D-T2w) sequence, and a two-dimensional T2-weighted (2D-T2w) sequence. The relative performance of sequences was assessed using visual grading characteristic analysis. Interobserver agreement was assessed using κ statistics. For evaluation of physical image quality characteristics, signal-to-noise ratio (SNR) and contrast-to-noise ratio (CNR) were calculated and compared using Wilcoxon’s test. SNR and CNR measurements were correlated with visual grading results.
Results
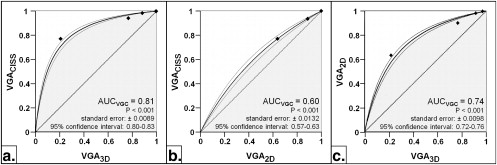
Visual grading characteristic analysis showed significantly better image quality ratings for the CISS sequence compared to the 3D-T2w and 2D-T2w sequence, and the 2D-T2w sequence performed significantly better compared to the 3D-T2w sequence ( P < .001). Interobserver agreement was substantial (κ = 0.66–0.73). Wilcoxon’s test revealed significantly higher SNR and CNR values for the 2D-T2w sequence compared to the 3D-T2w and CISS sequences, and SNR and CNR values for the 3D-T2w sequence were significantly higher compared to those for the CISS sequence ( P < .001 for each). Significant correlation between SNR and CNR and visual grading was found for the 3D-T2w sequence (SNR: ρ = 0.510, P = .015; CNR: ρ = 0.546, P = .009).
Conclusions
High-resolution 3-T MRI resulted in excellent values for SNR and CNR, suggesting the appropriateness of the sequences for olfactory bulb MRI volumetry. Visual grading characteristic analysis revealed the CISS sequence to be the most suitable for olfactory bulb volumetry.
The topic of olfactory bulb (OB) volumetry is becoming increasingly important in understanding olfactory dysfunction and has already been used as a complementary prognostic tool for radiologic diagnosis, to predict outcomes in olfactory disorders , or as a marker in neurodegenerative disorders such as Alzheimer’s disease . The OB is the first cerebral olfactory structure, which processes afferent information from the olfactory receptor neurons . Furthermore, the human OB retains its ability to renew cell population, because in the OB, progenitor cells differentiate into neurons until well into adulthood . Therefore, the OB exhibits high structural plasticity, whereby OB volume is correlated with afferent neural activity . Dynamic volumetric changes have been demonstrated for different etiologies of smelling disorders. A decrease in volume has been verified for trauma , infection , idiopathic olfactory disorders , schizophrenia , Alzheimer’s disease , depression , and sinonasal disease . One recent study also showed an OB volume increase after successful olfactory rehabilitation in sinonasal diseases . Additionally, a positive correlation of OB volume with age-related olfactory function has been reported .
Magnetic resonance imaging (MRI) of the olfactory system became possible in the late 1980s . Further development of MRI techniques, including improvements in spatial resolution, enabled the assessment of OB volume . Although MRI is a feasible method for OB volumetry , further studies at 1.5 T were inconsistent in the application of the sequence types (eg, T1-weighted [T1w] vs T2-weighted [T2w]) and differed in numerous scanning parameters (eg, slice thickness) or the use of technical equipment (eg, surface vs head coils) . Data from a systematic comparison of sequences for detection of human olfactory nerve anatomy at 1.5 T are limited. As a result, a reference standard in imaging for OB MRI volumetry has not been established. The limited resolution gained at 1.5 T complicates the comparative quantification of volumetric results of this small paleocortical structure. One major advantage of high-field MRI (3 T) is an increased signal-to-noise ratio (SNR). This higher SNR can be invested in better spatial resolution . Until now, a systematic radiologic comparison of sequences for OB volumetry at a field strength of 3 T has not been performed.
Get Radiology Tree app to read full this article<
Materials and methods
Participant Recruitment and Sampling
Get Radiology Tree app to read full this article<
Imaging Procedures
Get Radiology Tree app to read full this article<
Data Analysis
Get Radiology Tree app to read full this article<
Get Radiology Tree app to read full this article<
Get Radiology Tree app to read full this article<
Get Radiology Tree app to read full this article<
Table 1
Ordinal Scale Step Categorization for Visual Grading Analysis
Step Image Quality Limitations for Volumetry 1 Excellent No limitations 2 Good Minimal limitations 3 Sufficient Moderate limitations, no substantial loss of information 4 Restricted Relevant limitations, clear loss of information 5 Poor Image not usable, loss of information, image must be repeated
Get Radiology Tree app to read full this article<
Get Radiology Tree app to read full this article<
SNR¯¯¯¯¯¯¯=1n∑ni=1SICSFiσi, SNR
¯
=
1
n
∑
i
=
1
n
SI
i
CSF
σ
i
,
where SI CSF is the SI of CSF in the OB cistern, and σ is the SI standard deviation of the pure image noise.
Get Radiology Tree app to read full this article<
Get Radiology Tree app to read full this article<
CNR¯¯¯¯¯¯¯=1n∑ni=1∣∣SICSFi−SIOBi∣∣σi, CNR
¯
=
1
n
∑
i
=
1
n
|
SI
i
CSF
−
SI
i
OB
|
σ
i
,
where SI CSF is the SI of CSF in the OB cistern, SI OB is the SI of the OB, and σ is the SI standard deviation of the pure image noise.
Get Radiology Tree app to read full this article<
Get Radiology Tree app to read full this article<
![Figure 1, Comparison of applied sequences depicting the olfactory bulb (OB) in the olfactory fossa (coronal plane) at 3 T. (a) Constructive interference in steady state sequence (repetition time [TR], 11.68 ms; echo time [TE], 5.84 ms; voxel size, 0.125 mm 3 ). (b) Corresponding three-dimensional T2-weighted image (TR, 1000 ms; TE, 132 ms; voxel size, 0.125 mm 3 ). (c) Corresponding two-dimensional T2-weighted image (TR, 4800 ms; TE, 150 ms; voxel size, 0.32 mm 3 ). Right olfactory bulb (white arrow), proper olfactory artery in the olfactory cistern (white arrowheads), left olfactory sulcus (white star). I, inferior; L, left; R, right; S, superior.](https://storage.googleapis.com/dl.dentistrykey.com/clinical/VisualGradingCharacteristicsVGCAnalysisofDiagnosticImageQualityforHighResolution3TeslaMRIVolumetryoftheOlfactoryBulb/0_1s20S1076633211000420.jpg)
Get Radiology Tree app to read full this article<
Statistical Analysis
Get Radiology Tree app to read full this article<
Get Radiology Tree app to read full this article<
Get Radiology Tree app to read full this article<
Get Radiology Tree app to read full this article<
Get Radiology Tree app to read full this article<
Results
Participant Recruitment and Sampling
Get Radiology Tree app to read full this article<
VGC Analysis
Get Radiology Tree app to read full this article<
Get Radiology Tree app to read full this article<
Get Radiology Tree app to read full this article<
Physical Measurements of Image Quality
Get Radiology Tree app to read full this article<
Get Radiology Tree app to read full this article<
Get Radiology Tree app to read full this article<
Discussion
Get Radiology Tree app to read full this article<
Get Radiology Tree app to read full this article<
Get Radiology Tree app to read full this article<
Get Radiology Tree app to read full this article<
Get Radiology Tree app to read full this article<
Conclusions
Get Radiology Tree app to read full this article<
References
1. Duprez T.P., Rombaux P.: Imaging the olfactory tract (cranial nerve #1). Eur J Radiol 2010; 74: pp. 288-298.
2. Rombaux P., Duprez T., Hummel T.: Olfactory bulb volume in the clinical assessment of olfactory dysfunction. Rhinology 2009; 47: pp. 3-9.
3. Gottfried J.A.: Smell: central nervous processing. Adv Otorhinolaryngol 2006; 63: pp. 44-69.
4. Bédard A., Parent A.: Evidence of newly generated neurons in the human olfactory bulb. Dev Brain Res 2004; 151: pp. 159-168.
5. Abolmaali N., Gudziol V., Hummel T.: Pathology of the olfactory nerve. Neuroimaging Clin North Am 2008; 18: pp. 233-242.
6. Yousem D.M., Geckle R.J., Bilker W.B., et. al.: Posttraumatic olfactory dysfunction: MR and clinical evaluation. AJNR Am J Neuroradiol 1996; 17: pp. 1171-1179.
7. Mueller A., Rodewald A., Reden J., et. al.: Reduced olfactory bulb volume in post-traumatic and post-infectious olfactory dysfunction. Neuroreport 2005; 16: pp. 475-478.
8. Rombaux P., Potier H., Markessis E., et. al.: Olfactory bulb volume and depth of olfactory sulcus in patients with idiopathic olfactory loss. Eur Arch Otorhinolaryngol 2010; 267: pp. 1551-1556.
9. Turetsky B.I., Moberg P.J., Yousem D.M., et. al.: Reduced olfactory bulb volume in patients with schizophrenia. Am J Psychiatry 2000; 157: pp. 828-830.
10. Negoias S., Croy I., Gerber J., et. al.: Reduced olfactory bulb volume and olfactory sensitivity in patients with acute major depression. Neuroscience 2010; 169: pp. 415-421.
11. Rombaux P., Potier H., Bertrand B., et. al.: Olfactory bulb volume in patients with sinonasal disease. Am J Rhinol 2008; 22: pp. 598-601.
12. Gudziol V., Buschhuter D., Abolmaali N., et. al.: Increasing olfactory bulb volume due to treatment of chronic rhinosinusitis—a longitudinal study. Brain 2009; 132: pp. 3096-3101.
13. Yousem D.M., Geckle R.J., Bilker W.B., et. al.: Olfactory bulb and tract and temporal lobe volumes. Normative data across decades. Ann N Y Acad Sci 1998; 855: pp. 546-555.
14. Suzuki M., Takashima T., Kadoya M., et. al.: MR imaging of olfactory bulbs and tracts. AJNR Am J Neuroradiol 1989; 10: pp. 955-957.
15. Yousem D.M., Geckle R.J., Doty R.L., et. al.: Reproducibility and reliability of volumetric measurements of olfactory eloquent structures. Acad Radiol 1997; 4: pp. 264-269.
16. Turetsky B.I., Moberg P.J., Arnold S.E., et. al.: Low olfactory bulb volume in first-degree relatives of patients with schizophrenia. Am J Psychiatry 2003; 160: pp. 703-708.
17. Held P., Seitz J., Frund R., et. al.: MRI detection of olfactory bulb and tract. J Neuroradiol 2000; 27: pp. 112-118.
18. Schmitt F., Grosu D., Mohr C., et. al.: 3 Tesla MRI: successful results with higher field strengths [article in German]. Radiologe 2004; 44: pp. 31-47.
19. Bath M., Mansson L.G.: Visual grading characteristics (VGC) analysis: a non-parametric rank-invariant statistical method for image quality evaluation. Br J Radiol 2007; 80: pp. 169-176.
20. Leblanc A.: Olfactory nerves.Leblanc A.Encephalo-Peripheral Nervous System: Vascularisation, Anatomy, Imaging.2001.Springer-VerlagBerlin, Germany:pp. 1-19.
21. Keros P.: On the practical value of differences in the level of the lamina cribrosa of the ethmoid [article in German]. Z Laryngol Rhinol Otol 1962; 41: pp. 809-813.
22. Vasvari G., Reisch R., Patonay L.: Surgical anatomy of the cribriform plate and adjacent areas. Minim Invasive Neurosurg 2005; 48: pp. 25-33.
23. Ludewig E., Richter A., Frame M.: Diagnostic imaging—evaluating image quality using visual grading characteristic (VGC) analysis. Vet Res Commun 2010; 34: pp. 473-479.
24. Landis J.R., Koch G.G.: The measurement of observer agreement for categorical data. Biometrics 1977; 33: pp. 159-174.
25. Aickin M., Gensler H.: Adjusting for multiple testing when reporting research results: the Bonferroni vs Holm methods. Am J Public Health 1996; 86: pp. 726-728.
26. Mueller A., Abolmaali N.D., Hakimi A.R., et. al.: Olfactory bulb volumes in patients with idiopathic Parkinson’s disease a pilot study. J Neural Transm 2005; 112: pp. 1363-1370.
27. Rombaux P., Mouraux A., Bertrand B., et. al.: Olfactory function and olfactory bulb volume in patients with postinfectious olfactory loss. Laryngoscope 2006; 116: pp. 436-439.
28. Buschhuter D., Smitka M., Puschmann S., et. al.: Correlation between olfactory bulb volume and olfactory function. Neuroimage 2008; 42: pp. 498-502.
29. Haehner A., Rodewald A., Gerber J.C., et. al.: Correlation of olfactory function with changes in the volume of the human olfactory bulb. Arch Otolaryngol Head Neck Surg 2008; 134: pp. 621-624.
30. Abolmaali N., Hummel T., Damm M.: Two- and three-dimensional, morphologic and functional MR-imaging in smelling disorders [article in German]. Laryngorhinootologie 2009; 88: pp. 10-16.
31. Goektas O., Fleiner F., Sedlmaier B., et. al.: Correlation of olfactory dysfunction of different etiologies in MRI and comparison with subjective and objective olfactometry. Eur J Radiol 2009; 71: pp. 469-473.
32. Rombaux P., Grandin C., Duprez T.: How to measure olfactory bulb volume and olfactory sulcus depth?. B-ENT 2009; 5: pp. 53-60.
33. Bauknecht H.C., Jach C., Fleiner F., et. al.: Olfactory dysfunction: correlation of olfactory bulb volume on MRI and objective olfactometry [article in German]. Rofo 2010; 182: pp. 163-168.
34. Yousem D.M., Geckle R.J., Bilker W.B., et. al.: Posttraumatic smell loss: relationship of psychophysical tests and volumes of the olfactory bulbs and tracts and the temporal lobes. Acad Radiol 1999; 6: pp. 264-272.
35. Casselman J.W., Kuhweide R., Deimling M., et. al.: Constructive interference in steady state-3DFT MR imaging of the inner ear and cerebellopontine angle. AJNR Am J Neuroradiol 1993; 14: pp. 47-57.
36. Dietrich O., Reiser M.F., Schoenberg S.O.: Artifacts in 3-T MRI: physical background and reduction strategies. Eur J Radiol 2008; 65: pp. 29-35.
37. Sandborg M., Tingberg A., Dance D.R., et. al.: Demonstration of correlations between clinical and physical image quality measures in chest and lumbar spine screen-film radiography. Br J Radiol 2001; 74: pp. 520-528.
38. Vikgren J., Johnsson Å.A., Flinck A., et. al.: High-resolution computed tomography with 16-row MDCT: a comparison regarding visibility and motion artifacts of dose-modulated thin slices and “step and shoot” images. Acta Radiologica 2008; 49: pp. 755-760.