
Rationale and Objectives
To investigate the volume-doubling time (VDT) of histologically proved pulmonary nodules showing ground glass opacity (GGO) at multidetector CT (MDCT) using computer-aided three-dimensional volumetry.
Materials and Methods
We retrospectively evaluated 47 GGO nodules (mixed n = 28, pure n = 19) that had been examined by thin-section helical CT more than once. They were histologically confirmed as atypical adenomatous hyperplasia (AAH, n = 13), bronchioloalveolar carcinoma (BAC, n = 22), and adenocarcinoma (AC, n = 12). Using computer-aided three-dimensional volumetry software, two radiologists independently performed volumetry of GGO nodules and calculated the VDT using data acquired from the initial and final CT study. We compared VDT among the three pathologies and also compared the VDT of mixed and pure GGO nodules.
Results
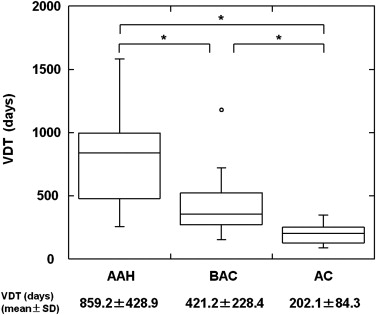
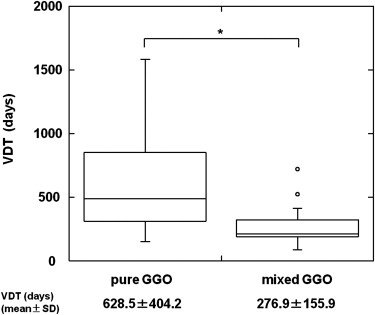
The mean VDT of all GGO nodules was 486.4 ± 368.6 days (range 89.0–1583.0 days). The mean VDT for AAH, BAC, and AC was 859.2 ± 428.9, 421.2 ± 228.4, and 202.1 ± 84.3 days, respectively; there were statistically significant differences for all comparative combinations of AAH, BAC, and AC (Steel-Dwass test, P < .01). The mean VDT for pure and mixed GGO nodules was 628.5 ± 404.2 and 276.9 ± 155.9 days, respectively; it was significantly shorter for mixed than pure GGO nodules (Mann-Whitney U-test, P < .01).
Conclusion
The evaluation of VDT using computer-aided volumetry may be helpful in assessing the histological entities of GGO nodules.
The introduction of computed tomography (CT) lung cancer screening has increased the number of detected ground glass opacity (GGO) nodules. Henschke et al reported that 44 (19%) of 233 positive results were lesions with GGO nodules; 15 (34%) of the 44 lesions were malignant. Among lesions with a solid component (mixed GGO nodules), 63% were malignant, nodules without solid components (pure GGO nodules) had a lower malignancy rate (18%). GGO nodules may be attributable to focal inflammation, focal interstitial fibrosis , atypical adenomatous hyperplasia (AAH) , bronchioloalveolar carcinoma (BAC) , or adenocarcinoma (AC) . Although the differentiation of BAC and AC, which are malignant, from other diseases is important, it can be difficult on a single CT study . Many inflammatory lesions resolve spontaneously or with antibiotic treatment , on the other hand, the size of GGO nodules attributable to BAC or AC gradually increases . As focal interstitial fibrosis and AAH with pure GGO tend to remain stable in size for months or years , monitoring the nodule size for several months by high-resolution CT (HRCT) can help in obtaining a differential diagnosis. The reported average doubling time of BAC, calculated from the maximal tumor diameter with the Schwartz equation , is very long (457–813 days on average) , therefore, visual evaluation of the growth rate on axial CT image may be unreliable.
Accurate three-dimensional (3D) computer-aided volumetry (CAV) software to assess pulmonary nodules with volumetric data obtained at multidetector CT (MDCT) is available . However, most of the software used in earlier studies only evaluated solid pulmonary nodules and CAV of GGO nodules can be difficult . We developed enhanced CAV software to measure not only the volume of solid and of GGO nodules; it yielded sufficiently accurate and reproducible volume measurements .
Get Radiology Tree app to read full this article<
Materials and methods
Get Radiology Tree app to read full this article<
Patients and Nodule Selection
Get Radiology Tree app to read full this article<
Table 1
Clinical and Pathologic Characteristics of All 47 GGO Nodules
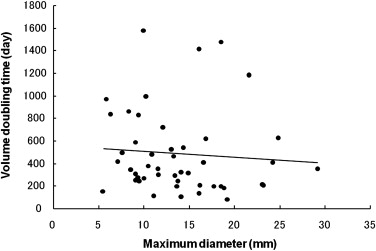
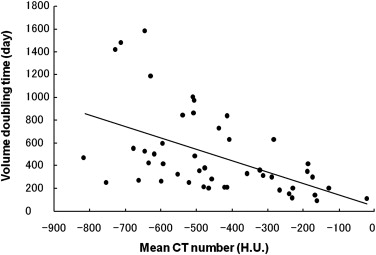
AAH BAC AC Nodules (patients) 13 (9) 22 (20) 12 (10) Patient sex Male 6 6 3 Female 7 16 9 Mean age (year) 58.8 ± 13.1 63.9 ± 9.0 67.4 ± 6.1 GGO subtype Pure-GGO 13 14 1 Mixed-GGO 0 8 11 Mean maximum diameter (mm) 10.1 ± 3.2 13.3 ± 5.6 13.4 ± 4.6 Mean CT attenuation (HU) −614.5 ± 98.4 −611.4 ± 123.0 −323.3 ± 210.7 Mean interval between two CT scans (days) 331.6 ± 436.9 123.9 ± 118.5 85.9 ± 39.8
AAH, atypical adenomatous hyperplasia; BAC, bronchioloalveolar carcinoma; AC, adenocarcinoma.
Get Radiology Tree app to read full this article<
Image Acquisition
Get Radiology Tree app to read full this article<
Computerized Volumetry of Pulmonary Nodules
Get Radiology Tree app to read full this article<
Get Radiology Tree app to read full this article<
Get Radiology Tree app to read full this article<
Get Radiology Tree app to read full this article<
Evaluation of Volume Doubling Time
Get Radiology Tree app to read full this article<
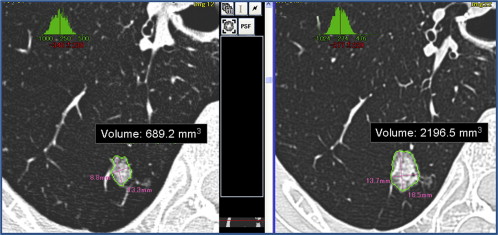
VDT=[log2×t]/[log(V2/V1)], VDT
=
[
log
2
×
t
]
/
[
log
(
V
2
/
V
1
)
]
,
where V 1 and V 2 are the initial and final nodule volume and t is the interval between the two CT scans. The software calculates the VDT automatically by comparing the nodule volume on the two scans ( Fig 2 ). The average value of the two radiologists’ measurements of VDT was adopted.
Get Radiology Tree app to read full this article<
Statistical Analysis
Get Radiology Tree app to read full this article<
Get Radiology Tree app to read full this article<
Results
Get Radiology Tree app to read full this article<
Get Radiology Tree app to read full this article<
Get Radiology Tree app to read full this article<
Get Radiology Tree app to read full this article<
Get Radiology Tree app to read full this article<
Get Radiology Tree app to read full this article<
Get Radiology Tree app to read full this article<
Discussion
Get Radiology Tree app to read full this article<
Get Radiology Tree app to read full this article<
Get Radiology Tree app to read full this article<
Get Radiology Tree app to read full this article<
Get Radiology Tree app to read full this article<
Get Radiology Tree app to read full this article<
References
1. Henschke C.I., Yankelevitz D.F., Mirtcheva R., et. al.: CT screening for lung cancer: frequency and significance of part-solid and nonsolid nodules. AJR Am J Roentgenol 2002; 178: pp. 1053-1057.
2. Park C.M., Goo J.M., Lee H.J., et. al.: Focal interstitial fibrosis manifesting as nodular ground-glass opacity: thin-section CT findings. Eur Radiol 2007; 17: pp. 2325-2331.
3. Nakajima R., Yokose T., Kakinuma R., et. al.: Localized pure ground-glass opacity on high-resolution CT: histologic characteristics. J Comput Assist Tomogr 2002; 26: pp. 323-329.
4. Nakata M., Saeki H., Takata I., et. al.: Focal ground-glass opacity detected by low-dose helical CT. Chest 2002; 121: pp. 1464-1467.
5. Kuriyama K., Seto M., Kasugai T., et. al.: Ground-glass opacity on thin-section CT: value in differentiating subtypes of adenocarcinoma of the lung. AJR Am J Roentgenol 1999; 173: pp. 465-469.
6. Kim H.Y., Shim Y.M., Lee K.S., et. al.: Persistent pulmonary nodular ground-glass opacity at thin-section CT: histopathologic comparisons. Radiology 2007; 245: pp. 267-275.
7. Aoki T., Nakata H., Watanabe H., et. al.: Evolution of peripheral lung adenocarcinomas: CT findings correlated with histology and tumor doubling time. AJR Am J Roentgenol 2000; 174: pp. 763-768.
8. Aoki T., Tomoda Y., Watanabe H., et. al.: Peripheral lung adenocarcinoma: correlation of thin-section CT findings with histologic prognostic factors and survival. Radiology 2001; 220: pp. 803-809.
9. Kakinuma R., Ohmatsu H., Kaneko M., et. al.: Progression of focal pure ground-glass opacity detected by low-dose helical computed tomography screening for lung cancer. J Comput Assist Tomogr 2004; 28: pp. 17-23.
10. Schwartz M.: A biomathematical approach to clinical tumor growth. Cancer 1961; 14: pp. 1272-1294.
11. Hasegawa M., Sone S., Takashima S., et. al.: Growth rate of small lung cancers detected on mass CT screening. Br J Radiol 2000; 73: pp. 1252-1259.
12. Wormanns D., Kohl G., Klotz E., et. al.: Volumetric measurements of pulmonary nodules at multi-row detector CT: in vivo reproducibility. Eur Radiol 2004; 14: pp. 86-92.
13. Kostis W.J., Reeves A.P., Yankelevitz D.F., et. al.: Three-dimensional segmentation and growth-rate estimation of small pulmonary nodules in helical CT images. IEEE Trans Med Imaging 2003; 22: pp. 1259-1274.
14. Ko J.P., Rusinek H., Jacobs E.L., et. al.: Small pulmonary nodules: volume measurement at chest CT—phantom study. Radiology 2003; 228: pp. 864-870.
15. Yankelevitz D.F., Reeves A.P., Kostis W.J., et. al.: Small pulmonary nodules: volumetrically determined growth rates based on CT evaluation. Radiology 2000; 217: pp. 251-256.
16. Bolte H., Riedel C., Jahnke T., et. al.: Reproducibility of computer-aided volumetry of artificial small pulmonary nodules in ex vivo porcine lungs. Invest Radiol 2006; 41: pp. 28-35.
17. Oda S., Awai K., Murao K., et. al.: Computer-aided volumetry of pulmonary nodules exhibiting ground-glass opacity at MDCT. AJR Am J Roentgenol 2010; 194: pp. 398-406.
18. Awai K., Murao K., Ozawa A., et. al.: Pulmonary nodules: estimation of malignancy at thin-section helical CT—effect of computer-aided diagnosis on performance of radiologists. Radiology 2006; 239: pp. 276-284.
19. Dougherty E.: Digital image processing method.1994.DekkerNew York
20. Usuda K., Saito Y., Sagawa M., et. al.: Tumor doubling time and prognostic assessment of patients with primary lung cancer. Cancer 1994; 74: pp. 2239-2244.
21. Lillington G.A.: Management of solitary pulmonary nodules. Dis Mon 1991; 37: pp. 271-318.
22. Hayabuchi N., Russell W.J., Murakami J.: Slow-growing lung cancer in a fixed population sample. Radiologic assessments. Cancer 1983; 52: pp. 1098-1104.
23. Lindell R.M., Hartman T.E., Swensen S.J., et. al.: Five-year lung cancer screening experience: CT appearance, growth rate, location, and histologic features of 61 lung cancers. Radiology 2007; 242: pp. 555-562.
24. Godoy M.C., Naidich D.P.: Subsolid pulmonary nodules and the spectrum of peripheral adenocarcinomas of the lung: recommended interim guidelines for assessment and management. Radiology 2009; 253: pp. 606-622.
25. de Hoop B., Gietema H., van de Vorst S., et. al.: Pulmonary ground-glass nodules: increase in mass as an early indicator of growth. Radiology 2010; 255: pp. 199-206.
26. Noguchi M., Morikawa A., Kawasaki M., et. al.: Small adenocarcinoma of the lung. Histologic characteristics and prognosis. Cancer 1995; 75: pp. 2844-2852.
27. Nakata M., Sawada S., Saeki H., et. al.: Prospective study of thoracoscopic limited resection for ground-glass opacity selected by computed tomography. Ann Thorac Surg 2003; 75: pp. 1601-1605. discussion 1605–1606
28. Petkovska I., Brown M.S., Goldin J.G., et. al.: The effect of lung volume on nodule size on CT. Acad Radiol 2007; 14: pp. 476-485.
29. Winer-Muram H.T., Jennings S.G., Meyer C.A., et. al.: Effect of varying CT section width on volumetric measurement of lung tumors and application of compensatory equations. Radiology 2003; 229: pp. 184-194.
30. Kostis W.J., Yankelevitz D.F., Reeves A.P., et. al.: Small pulmonary nodules: reproducibility of three-dimensional volumetric measurement and estimation of time to follow-up CT. Radiology 2004; 231: pp. 446-452.
31. Nietert P.J., Ravenel J.G., Leue W.M., et. al.: Imprecision in automated volume measurements of pulmonary nodules and its effect on the level of uncertainty in volume doubling time estimation. Chest 2009; 135: pp. 1580-1587.
32. Linning E., Daqing M.: Volumetric measurement pulmonary ground-glass opacity nodules with multi-detector CT: effect of various tube current on measurement accuracy—a chest CT phantom study. Acad Radiol 2009; 16: pp. 934-939.
33. Das M., Ley-Zaporozhan J., Gietema H.A., et. al.: Accuracy of automated volumetry of pulmonary nodules across different multislice CT scanners. Eur Radiol 2007; 17: pp. 1979-1984.
34. Das M., Muhlenbruch G., Katoh M., et. al.: Automated volumetry of solid pulmonary nodules in a phantom: accuracy across different CT scanner technologies. Invest Radiol 2007; 42: pp. 297-302.