
Rationale and Objectives
In current practice, radiologists interpret digital images, including a substantial amount of volumetric images. We hypothesized that interpretation of a stack of a volumetric data set demands different skills than interpretation of two-dimensional (2D) cross-sectional images. This study aimed to investigate and compare knowledge and skills used for interpretation of volumetric versus 2D images.
Materials and Methods
Twenty radiology clerks were asked to think out loud while reading four or five volumetric computed tomography (CT) images in stack mode and four or five 2D CT images. Cases were presented in a digital testing program allowing stack viewing of volumetric data sets and changing views and window settings. Thoughts verbalized by the participants were registered and coded by a framework of knowledge and skills concerning three components: perception, analysis, and synthesis. The components were subdivided into 16 discrete knowledge and skill elements. A within-subject analysis was performed to compare cognitive processes during volumetric image readings versus 2D cross-sectional image readings.
Results
Most utterances contained knowledge and skills concerning perception (46%). A smaller part involved synthesis (31%) and analysis (23%). More utterances regarded perception in volumetric image interpretation than in 2D image interpretation (Median 48% vs 35%; z = −3.9; P < .001). Synthesis was less prominent in volumetric than in 2D image interpretation (Median 28% vs 42%; z = −3.9; P < .001). No differences were found in analysis utterances.
Conclusions
Cognitive processes in volumetric and 2D cross-sectional image interpretation differ substantially. Volumetric image interpretation draws predominantly on perceptual processes, whereas 2D image interpretation is mainly characterized by synthesis. The results encourage the use of volumetric images for teaching and testing perceptual skills.
Introduction
The daily practice of radiologists has changed since the introduction of cross-sectional imaging techniques (eg, computed tomography [CT] and magnetic resonance imaging) and digital viewing systems . Digital volumetric data sets have been introduced, which can be scrolled through in different planes and window settings. Volumetric image sets are increasingly used because this is advantageous for identification and analysis of radiologic abnormalities . We expect that the interpretation of stacks of volumetric data sets demands different skills than interpretation of two-dimensional (2D) images . For example, visual search patterns in stack mode viewing of CT images differ from tiled mode viewing . Drew et al. found that the pattern of errors made in volumetric CT image interpretation differs from error patterns in interpretation of 2D images, which were chest x-rays in this case, as decision errors are less common in CT image interpretation . In volumetric image interpretation, radiologists need to navigate through and manipulate images to identify and analyze lesions. Although the multidimensional information enables a radiologist to observe the image features in detail, this requires the processing of much more information which could make the radiologist’s search more complex and time consuming .
As radiology practice has changed, and cognitive processes in image interpretation may have consequently altered, traditional 2D teaching methods may not align well with the knowledge and skills required for current practice . To gain insight in image interpretation skills for educational purposes, it is useful to explore which cognitive processes occur in volumetric image interpretation and how these differ from 2D image interpretation.
Get Radiology Tree app to read full this article<
Get Radiology Tree app to read full this article<
Get Radiology Tree app to read full this article<
Get Radiology Tree app to read full this article<
Get Radiology Tree app to read full this article<
Materials and methods
Study Design
Get Radiology Tree app to read full this article<
Participants and Setting
Get Radiology Tree app to read full this article<
Instrumentation
Image Cases
Get Radiology Tree app to read full this article<
Digital Assessment Environment
Get Radiology Tree app to read full this article<
Image Display
Get Radiology Tree app to read full this article<
Coding Scheme
Get Radiology Tree app to read full this article<
Procedure
Image Reading
Get Radiology Tree app to read full this article<
Coding Process
Get Radiology Tree app to read full this article<
Data Analysis
Get Radiology Tree app to read full this article<
Institutional Review Board Approval
Get Radiology Tree app to read full this article<
Results
Get Radiology Tree app to read full this article<
Table 1
Examples of Verbalizations of Knowledge and Skill Items
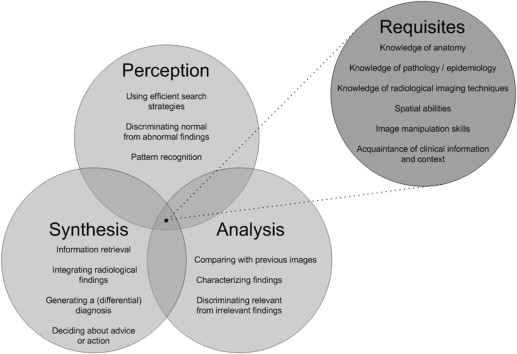
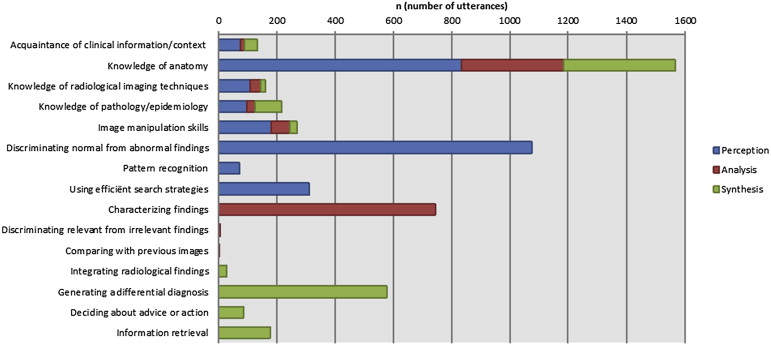
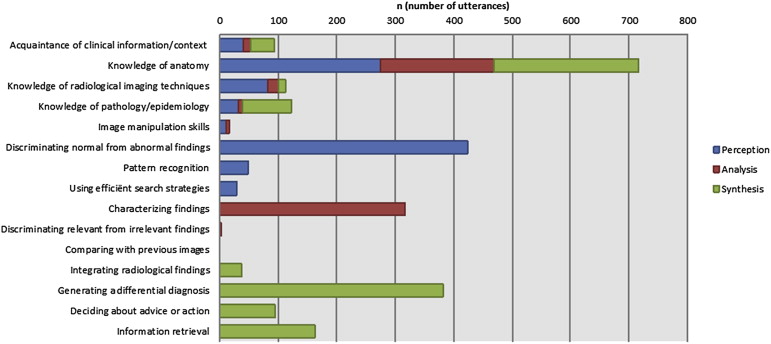
Framework Components Code Items Examples Requisites ∗ Knowledge of anatomy “ This is the posterior edge of the maxillary sinus. ” (perception, subdural hematoma and maxillary sinus fracture) Knowledge of pathology/epidemiology “The filling defect seems to be situated in the middle of the vessel. Of course, this is a sign of an acute pulmonary embolism.” (synthesis, pulmonary embolism with lung infarction) Knowledge of radiologic imaging techniques “Let’s see if there is contrast leakage present. I am not sure if a contrast agent is used. I think there is. ” (analysis, spleen laceration) Spatial abilities † — Image manipulation skills (navigating through, changing views or contrast) “ I always count vertebral bodies in the sagittal view. ” (perception, Jefferson fracture) Acquaintance of clinical information and context “I see a large hypodense area in the right hemisphere. This corresponds to the hemiparesis at the left. ” (analysis, brain infarction) Perception Using efficient search strategies “I try to divide the head in three parts. First, I examine the upper part, than the middle part and finally the lower part. ” (subarachnoid hemorrhage) Discriminating normal from abnormal findings “ I see abnormalities in the lung. The heart looks normal. ” (pulmonary contusion) Pattern recognition “Then we directly see what this is: a scapular fracture.” (scapular fracture) Analysis Comparing with previous images “A lesion in the left adrenal gland, probably an incidentaloma, though I can’t exclude malignancy. Besides, I don’t have anything to compare with. ” (diverticulitis) Characterizing findings “There is an increased density especially at the right side. ” (subarachnoid hemorrhage) Discriminating relevant from irrelevant findings “This is probably a renal cyst. I don’t think this is causing any problems. ” (aneurysm of the abdominal aorta) Synthesis Information retrieval “Fracture of (…) I would have to look up which bone has been broken.” (subdural hematoma and maxillary sinus fracture) Integrating radiologic findings “ I see air in the brain which is probably coming from the maxillary sinus which is fractured (…) This means there is a connection between the maxillary sinus and the brain which causes intracranial air. ” (subdural hematoma and maxillary sinus fracture) Generating a (differential) diagnosis “I believe this is an aortic dissection . Where does it start, before or behind the vessels? No behind, so it is type B. ” (aortic dissection) Deciding about advice or action “Cerebral herniation…if I was a radiology resident, I would have warned them that they should pay attention to that. ” (epidural hematoma)
Get Radiology Tree app to read full this article<
Get Radiology Tree app to read full this article<
Get Radiology Tree app to read full this article<
Get Radiology Tree app to read full this article<
Table 2
Distribution of Utterances Among Volumetric and 2D Image Interpretation
Volumetric 2D_N_ participants 20 20 Total number of utterances 5429 2563 Range among cases 11–253 7–60 Range among participants (average per case) 19–168 14–54 Mean completion time per case (s) 390 181
2D, two dimensional.
Get Radiology Tree app to read full this article<
Get Radiology Tree app to read full this article<
Table 3
Differences in Image Interpretation Components in 2D and Volumetric Image Interpretation
Component Volumetric 2D_P_ Value ∗ Effect Size (r) Total Median (%) Total Median (%) Perception 2751 47.9 945 34.6 <.001 .61 Analysis 1245 23.4 555 21.7 .31 .16 Synthesis 1433 27.8 1063 41.5 <.001 .61
2D, two dimensional.
Get Radiology Tree app to read full this article<
Get Radiology Tree app to read full this article<
Get Radiology Tree app to read full this article<
Get Radiology Tree app to read full this article<
Get Radiology Tree app to read full this article<
Discussion
Get Radiology Tree app to read full this article<
Get Radiology Tree app to read full this article<
Get Radiology Tree app to read full this article<
Get Radiology Tree app to read full this article<
Get Radiology Tree app to read full this article<
Get Radiology Tree app to read full this article<
Get Radiology Tree app to read full this article<
Get Radiology Tree app to read full this article<
Acknowledgments
Get Radiology Tree app to read full this article<
References
1. Andriole K.P., Wolfe J.M., Khorasani R., et. al.: Optimizing analysis, visualization, and navigation of large image data sets: one 5000-section CT scan can ruin your whole day. Radiology 2011; 259: pp. 346-362.
2. Reiner B.I., Siegel E.L., Siddiqui K.: Evolution of the digital revolution: a radiologist perspective. Journal of Digital Imaging 2003; 16: pp. 324-330.
3. Horton K.M., Johnson P.T., Fishman E.K.: MDCT of the abdomen: common misdiagnoses at a busy academic center. AJR Am J Roentgenol 2010; 194: pp. 660-667.
4. Hegarty M.: Components of spatial intelligence.2010.Psychology of learning and motivation. University of Illinois at Urbana-Champaign, Illinois: Elsevier Inc.pp. 265-297.
5. Ellis S.M., Hu X., Dempere-Marco L., et. al.: Thin-section CT of the lungs: eye-tracking analysis of the visual approach to reading tiled and stacked display formats. Eur J Radiol 2006; 59: pp. 257-264.
6. Drew T., Le-Hoa Vo M., Olwal A., et. al.: Scanners and drillers: characterizing expert visual search through volumetric images. Journal of Vision 2013; 13: pp. 3.
7. Kundel H.L., Nodine C.F., Carmody D.: Visual scanning, pattern recognition and decision-making in pulmonary nodule detection. Invest Radiol 1978; 13: pp. 175-181.
8. Ravesloot C.J., Van der Schaaf M., van Schaik J.P.J., et. al.: Volumetric CT-images improve testing of radiological image interpretation skills. European Journal of Radiology 2014;
9. Snow R.E., Jackson D., Corno L.: Individual differences in affective and conative functions.Berliner D.C.Calfee R.C.Handbook of educational psychology.1996.Simon & Schuster MacmillanNew York:pp. 243.
10. Lesgold A.M., Rubinson H., Feltovich P., et. al.: Chi M.T.H.Glaser R.Farr M.J.Expertise in a complex skill: diagnosing x-ray pictures.1988.Lawrence Erlbaum AssociatesHillsdale, New Jersey:
11. Raufaste E., Eyrolle H., Mariné C.: Pertinence generation in radiological diagnosis: spreading activation and the nature of expertise. Cognitive Science 1998; 22: pp. 517-546.
12. Morita W., Miwa K., Kitasaka T., et. al.: Interaction of perceptual and conceptual processing: expertise in medical image diagnosis. International journal of human-computer studies 2008; 66: pp. 370-390.
13. van der Gijp A., van der Schaaf M.F., van der Schaaf I.C., et. al.: Interpretation of radiological images: towards a framework of knowledge and skills. Adv Health Sci Educ Theory Pract 2014 Jan 22;
14. Ericsson K.A., Simon H.A.: Protocol analysis: verbal reports as data.1993.Massachusetts Institute of TechnologyLondon
15. Rikers R.M., Schmidt H.G., Boshuizen H.P.: Knowledge encapsulation and the intermediate effect. Contemporary Educational Psychology 2000; 25: pp. 150-166.
16. VQuest. [cited 2014 August]; Available from: www.vquest.nl .
17. Ravesloot C.J., Van der Gijp A., van der Schaaf M., et. al.: Support for external validity of radiological anatomy tests using volumetric images. Academic Radiology 2014; accepted
18. Stuijfzand BG, van der Schaaf MF, Kirschner FC, et al. Medical students’ working memory load in multiplanar image interpretation: insights from human-computer interactions and eye movements. submitted.
19. Morita J., Miwa K., Kitasaka T., et. al.: Interactions of perceptual and conceptual processing: expertise in medical image diagnosis. International journal of human-computer studies 2008; 66: pp. 370-390.
20. Chi M.T.: Quantifying qualitative analyses of verbal data: a practical guide. Journal of the Learning Sciences 1997; 6: pp. 271-315.
21. Littlefair S., Brennan P., Reed W., et. al.: Does the thinking aloud condition affect the search for pulmonary nodules?.Abbey C.K.MelloThoms C.R.Medical imaging 2012: image perception, observer performance, and technology assessment.2012.
22. Nodine C.F., Mello-Thoms C., Kundel H.L., et. al.: Time course of perception and decision making during mammographic interpretation. AJR Am J Roentgenol 2002; 179: pp. 917-923.
23. Nodine C.F., Kundel H.L., Lauver S.C., et. al.: Nature of expertise in searching mammograms for breast masses. Academic radiology 1996; 3: pp. 1000-1006.
24. Christensen E.E., Murry R.C., Holland K., et. al.: The effect of search time on perception. Radiology 1981; 138: pp. 361-365.
25. Krupinski E.A.: Visual scanning patterns of radiologists searching mammograms. Academic radiology 1996; 3: pp. 7-144.
26. Kundel H.L., Nodine C.F., Conant E.F., et. al.: Holistic component of image perception in mammogram interpretation: gaze-tracking study. Radiology 2007; 242: pp. 396-402.