
Rationale and Objectives
Renal perfusion measurements using noninvasive arterial spin-labeled (ASL) magnetic resonance imaging techniques are gaining interest. Currently, focus has been on perfusion in the context of renal transplant. Our objectives were to explore the use of ASL in patients with renal cancer, and to evaluate three-dimensional (3D) fast spin echo (FSE) acquisition, a robust volumetric imaging method for abdominal applications. We evaluate 3D ASL perfusion magnetic resonance imaging in the kidneys compared to two-dimensional (2D) ASL in patients and healthy subjects.
Materials and Methods
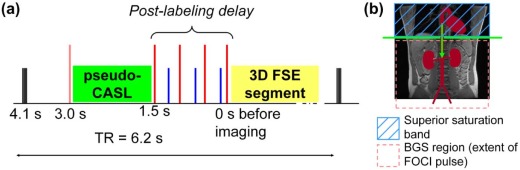
Isotropic resolution (2.6 × 2.6 × 2.8 mm 3 ) 3D ASL using segmented FSE was compared to 2D single-shot FSE. ASL used pseudo-continuous labeling, suppression of background signal, and synchronized breathing. Quantitative perfusion values and signal-to-noise ratio (SNR) were compared between 3D and 2D ASL in four healthy volunteers and semiquantitative assessments were made by four radiologists in four patients with known renal masses (primary renal cell carcinoma).
Results
Renal cortex perfusion in healthy subjects was 284 ± 21 mL/100 g/min, with test-retest repeatability of 8.8%. No significant differences were found between the quantitative perfusion value and SNR in volunteers between 3D ASL and 2D ASL, or in 3D ASL with synchronized or free breathing. In patients, semiquantitative assessment by radiologists showed no significant difference in image quality between 2D ASL and 3D ASL. In one case, 2D ASL missed a high perfusion focus in a mass that was seen by 3D ASL.
Conclusions
3D ASL renal perfusion imaging provides isotropic-resolution images, with comparable quantitative perfusion values and image SNR in similar imaging time to single-slice 2D ASL.
Introduction
Imaging the distribution and heterogeneity of tissue perfusion is an important component of clinical identification and characterization of primary and metastatic cancer. Quantitative perfusion measurements in tumors may be important for monitoring disease progression , in particular in response to antiangiogenic therapy , and may play a role in assessing the early changes of disease or in understanding normal physiology. There is increasing interest in perfusion measurements as a biomarker for assessing renal function and for characterizing renal masses. Quantitative perfusion is reduced in renal insufficiency and in hemodynamically significant renal artery stenosis . In renal cell carcinoma (RCC), perfusion has proven value because of the relationship between angiogenesis, prognosis, and response to different targeted therapies in these tumors .
Arterial spin labeling (ASL) is a well-established method for measuring tissue perfusion that has been widely used in quantitative perfusion measurements of the brain with application to brain tumors , cerebrovascular disease and stroke, epilepsy, and dementia . A major advantage of ASL is the relative ease with which ASL images can be converted to quantitative images of tissue perfusion. ASL employs external magnetic fields to label nuclear magnetization of endogenous water in arterial blood and then observes the effect on tissue signal after the water flows into and diffuses throughout the tissue. Freely diffusible endogenous water is an excellent tracer for perfusion that compares well to intravenously administered contrast material, because of its lower risk for renal patients and because signal is linear in concentration and independent of venous bolus dynamics and vessel permeability effects that complicate quantification of perfusion with intravenous contrast agents.
Get Radiology Tree app to read full this article<
Get Radiology Tree app to read full this article<
Materials and Methods
Get Radiology Tree app to read full this article<
MRI Imaging
Get Radiology Tree app to read full this article<
ASL
Get Radiology Tree app to read full this article<
Get Radiology Tree app to read full this article<
BGS
Get Radiology Tree app to read full this article<
Postlabeling Arterial Saturation
Get Radiology Tree app to read full this article<
Perfusion Quantification
Get Radiology Tree app to read full this article<
f=dMM0⋅λ2αT1,tissue×1exp(−δt/T1,blood)×(1−exp(−τ/T1,tissue))×exp(−(w−δt)/T1,tissue) f
=
d
M
M
0
⋅
λ
2
α
T
1
,
tissue
×
1
exp
(
−
δ
t
/
T
1
,
blood
)
×
(
1
−
e
x
p
(
−
τ
/
T
1
,
tissue
)
)
×
e
x
p
(
−
(
w
−
δ
t
)
/
T
1
,
tissue
)
Get Radiology Tree app to read full this article<
Get Radiology Tree app to read full this article<
3D FSE Acquisition
Get Radiology Tree app to read full this article<
Get Radiology Tree app to read full this article<
2D Single-shot FSE (SSFSE) Acquisition
Get Radiology Tree app to read full this article<
Quantitative Perfusion Imaging in Volunteers
Get Radiology Tree app to read full this article<
Renal Masses
Get Radiology Tree app to read full this article<
Statistical Analysis
Get Radiology Tree app to read full this article<
Get Radiology Tree app to read full this article<
SNRnorm=SNR3D×s2D⋅Nlcp√s3D⋅NET√ S
N
R
norm
=
S
N
R
3
D
×
s
2
D
⋅
N
lcp
s
3
D
⋅
N
ET
Get Radiology Tree app to read full this article<
Get Radiology Tree app to read full this article<
Get Radiology Tree app to read full this article<
Results
Get Radiology Tree app to read full this article<
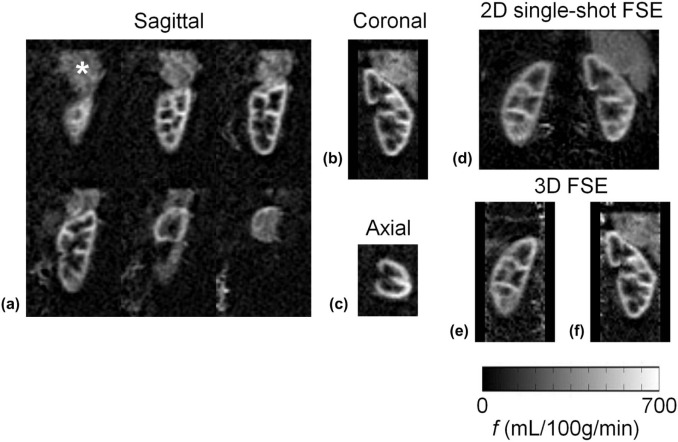
TABLE 1
Quantitative Perfusion Measurements (mL/100 g/min)
Sequence 3D FSE 2D Single-shot FSE Test Test Retest Free Breathing Test Kidney 1 239 236 227 231 Kidney 2 222 227 201 194 Kidney 3 318 290 285 272 Kidney 4 254 206 348 280 Kidney 5 377 375 298 347 Kidney 6 319 337 345 333 Kidney 7 261 282 236 316 Mean ± SE 284 ± 21 279 ± 23 277 ± 22 282 ± 21
2D/3D, two-/three-dimensional; FSE, fast spin echo.
Quantitative renal cortex perfusion measurements are given in mL/100 g/min for each of the tests and sequences. Kidneys 1–7 are left and right from normal volunteers 1–4. One kidney in one volunteer was not imaged. Mean ± standard error over seven kidneys is also given.
TABLE 2
Quantitative Perfusion Difference Image SNR
Sequence 3D FSE 2D Single-shot FSE Slice Thickness 11.2 mm 2.8 mm 11.2 mm 10 mm Synchronized Breathing Yes Yes No Yes Kidney 1 5.85 3.0 4.9 7.8 Kidney 2 5.82 3.2 4.1 6.0 Kidney 3 8.07 4.6 5.7 8.9 Kidney 4 6.37 4.2 9.3 8.8 Kidney 5 14.2 8.3 5.2 14.1 Kidney 6 11.1 6.2 8.3 12.5 Kidney 7 5.9 3.4 4.3 6.0 Average SNR (±SD) 8.2 ± 3.3 4.7 ± 1.9 6.0 ± 2.0 9.2 ± 3.1 Average SNR norm (±SD) 6.1 ± 2.1 14.1 ± 4.7 4.4 ± 1.3 9.2 ± 3.1
2D/3D, two-/three-dimensional; FSE, fast spin echo; ROI, region of interest; SNR, signal-to-noise ratio.
SNR values are calculated from average ROI signal on perfusion difference images on native 2.8-mm thick slices in the 3D sequence, or from the 11.2-mm thick average of four contiguous slices. The 2D slice was 10-mm thick. Kidneys 1–7 are left and right from normal volunteers 1–4. One kidney in one volunteer was not imaged. The average SNR ± standard deviation over 7 kidneys is also given, and finally the SNR value normalized for slice thickness and square-root-imaging time (SNRnorm). Also shown in one column are results from measurements made during free breathing compared to those with synchronized breathing.
Get Radiology Tree app to read full this article<
Get Radiology Tree app to read full this article<
![Figure 3, Three-dimensional perfusion difference images in patient 2 initially acquired in the sagittal plane with near-isotropic resolution 2.6 × 2.6 × 2.8 mm (a) allowed for reformatted images in (b) coronal and (c) axial orientations, displayed with 11.2-mm slice thickness. Perfusion is clearly high compared to surrounding parenchyma and of a heterogeneous nature, which correlates well with the anatomical appearance of the lesion (two-dimensional [2D] multislice single-shot fast spin echo [FSE]) shown in (d) . Scan time for this three-dimensional (3D) image data was ~5 minutes.](https://storage.googleapis.com/dl.dentistrykey.com/clinical/VolumetricArterialSpinlabeledPerfusionImagingoftheKidneyswithaThreedimensionalFastSpinEchoAcquisition/2_1s20S1076633215004225.jpg)
![Figure 4, Three-dimensional (3D) perfusion difference images in patient 1 initially acquired in the sagittal plane with near-isotropic resolution 2.6 × 2.6 × 2.8 mm (a) allowed for reformatted images in (b) coronal and (c) axial orientations, displayed with 11.2-mm slice thickness. Perfusion is clearly high compared to surrounding parenchyma and of a heterogeneous nature, which correlates well with the anatomical appearance of the lesion (two-dimensional [2D] multislice single-shot fast spin echo [FSE]) shown in ( d ). The lesion is very large and complex, extending beyond the borders of the kidney. Scan time for this 3D image data was ~5 min.](https://storage.googleapis.com/dl.dentistrykey.com/clinical/VolumetricArterialSpinlabeledPerfusionImagingoftheKidneyswithaThreedimensionalFastSpinEchoAcquisition/3_1s20S1076633215004225.jpg)
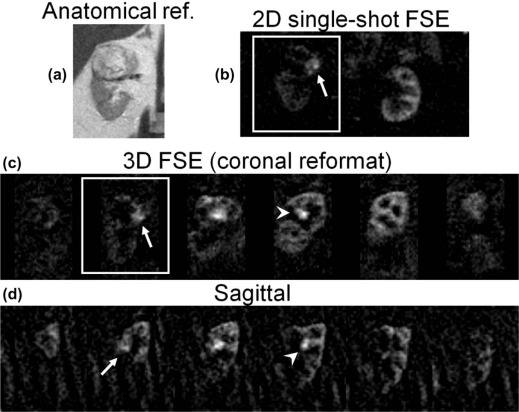
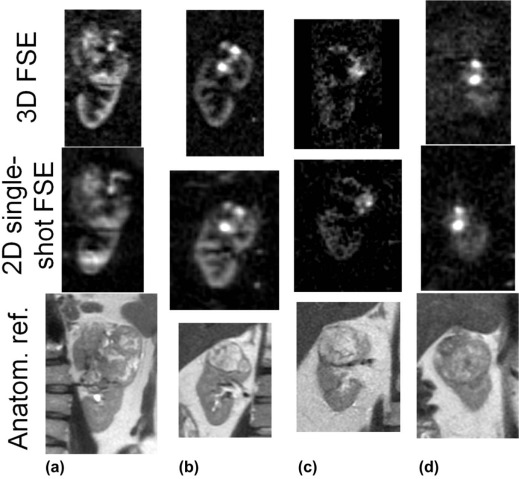
TABLE 3
Semiquantitative Assessment by Radiologists: Rating of Image Sharpness by Acquisition Sequence
Reader Patient Totals 1 2 3 4 n2D n3D 1 3D 3D 2D 3D 1 3 2 2D 3D 2D 2D 3 1 3 3D 3D 2D 2D 2 2 4 3D 3D 2D 3D 1 3
2D/3D, two-/three-dimensional.
The sequence preferred for image sharpness is given for each patient and each reader. The data are summarized per reader on the right, with n2D and n3D being the number of patients for which 2D and 3D imaging was preferred.
TABLE 4
Semiquantitative Assessment by Radiologists: Scores for Similarity of Perfusion Features Between Sequences
Reader Patient Average 1 2 3 4 1 4 4 4 5 4.25 2 4 3 2 2 2.75 3 4 4 2 3 3.25 4 3 4 4 5 4 Average 3.75 3.75 3 3.75 3.56
2D/3D, two-/three-dimensional.
Scores for the similarity in perfusion features between 2D and 3D sequences for each patient given by each reader are given, as well as averages by patient and reader.
Get Radiology Tree app to read full this article<
Discussion
Get Radiology Tree app to read full this article<
Get Radiology Tree app to read full this article<
Get Radiology Tree app to read full this article<
Get Radiology Tree app to read full this article<
Get Radiology Tree app to read full this article<
Get Radiology Tree app to read full this article<
Get Radiology Tree app to read full this article<
Get Radiology Tree app to read full this article<
Acknowledgments
Get Radiology Tree app to read full this article<
Get Radiology Tree app to read full this article<
References
1. Zanelli G.D., Fowler J.F.: The measurement of blood perfusion in experimental tumors by uptake of 86Rb. Cancer Res 1974; 34: pp. 1451-1456.
2. Murata R., Overgaard J., Horsman M.R.: Comparative effects of combretastatin A-4 disodium phosphate and 5,6-dimethylxanthenone-4-acetic acid on blood perfusion in a murine tumour and normal tissues. Int J Radiat Biol 2001; 77: pp. 195-204.
3. Anderson H., Yap J.T., Wells P., et. al.: Measurement of renal tumour and normal tissue perfusion using positron emission tomography in a phase II clinical trial of razoxane. Br J Cancer 2003; 89: pp. 262-267.
4. Faria S.C., Ng C.S., Hess K.R., et. al.: CT quantification of effects of thalidomide in patients with metastatic renal cell carcinoma. AJR Am J Roentgenol 2007; 189: pp. 378-385.
5. Sabir A., Schor-Bardach R., Wilcox C.J., et. al.: Perfusion MDCT enables early detection of therapeutic response to antiangiogenic therapy. AJR Am J Roentgenol 2008; 191: pp. 133-139.
6. Yang H.F., Du Y., Ni J.X., et. al.: Perfusion computed tomography evaluation of angiogenesis in liver cancer. Eur Radiol 2010; 20: pp. 1424-1430.
7. Berr S.S., Mai V.M.: Extraslice spin tagging (EST) magnetic resonance imaging for the determination of perfusion. J Magn Reson Imaging 1999; 9: pp. 146-150.
8. Fenchel M., Martirosian P., Langanke J., et. al.: Perfusion MR imaging with FAIR true FISP spin labeling in patients with and without renal artery stenosis: initial experience. Radiology 2006; 238: pp. 1013-1021.
9. Schoenberg S.O., Rieger J.R., Michaely H.J., et. al.: Functional magnetic resonance imaging in renal artery stenosis. Abdom Imaging 2006; 31: pp. 200-212.
10. Dong J., Yang L., Su T., et. al.: Quantitative assessment of acute kidney injury by noninvasive arterial spin labeling perfusion MRI: a pilot study. Sci China Life Sci 2013; 56: pp. 745-750.
11. De Bazelaire C., Rofsky N.M., Duhamel G., et. al.: Arterial spin labeling blood flow magnetic resonance imaging for the characterization of metastatic renal cell carcinoma(1). Acad Radiol 2005; 12: pp. 347-357.
12. de Bazelaire C., Alsop D.C., George D., et. al.: Magnetic resonance imaging-measured blood flow change after antiangiogenic therapy with PTK787/ZK 222584 correlates with clinical outcome in metastatic renal cell carcinoma. Clin Cancer Res 2008; 14: pp. 5548-5554.
13. Schor-Bardach R., Alsop D.C., Pedrosa I., et. al.: Does arterial spin-labeling MR imaging-measured tumor perfusion correlate with renal cell cancer response to antiangiogenic therapy in a mouse model?. Radiology 2009; 251: pp. 731-742.
14. Pedrosa I., Alsop D.C., Rofsky N.M.: Magnetic resonance imaging as a biomarker in renal cell carcinoma. Cancer 2009; 115: pp. 2334-2345.
15. Lanzman R.S., Robson P.M., Sun M.R., et. al.: Arterial spin-labeling MR imaging of renal masses: correlation with histopathologic findings. Radiology 2012; 265: pp. 799-808.
16. Pedrosa I., Rafatzand K., Robson P., et. al.: Arterial spin labeling MR imaging for characterisation of renal masses in patients with impaired renal function: initial experience. Eur Radiol 2012; 22: pp. 484-492.
17. Rossi C., Artunc F., Martirosian P., et. al.: Histogram analysis of renal arterial spin labeling perfusion data reveals differences between volunteers and patients with mild chronic kidney disease. Invest Radiol 2012; 47: pp. 490-496.
18. Detre J.A., Leigh J.S., Williams D.S., et. al.: Perfusion imaging. Magn Reson Med 1992; 23: pp. 37-45.
19. Williams D.S., Detre J.A., Leigh J.S., et. al.: Magnetic resonance imaging of perfusion using spin inversion of arterial water. Proc Natl Acad Sci U S A 1992; 89: pp. 212-216.
20. Zhang W., Williams D.S., Detre J.A., et. al.: Measurement of brain perfusion by volume-localized NMR spectroscopy using inversion of arterial water spins: accounting for transit time and cross-relaxation. Magn Reson Med 1992; 25: pp. 362-371.
21. Silva A.C., Kim S.G., Garwood M.: Imaging blood flow in brain tumors using arterial spin labeling. Magn Reson Med 2000; 44: pp. 169-173.
22. Warmuth C., Gunther M., Zimmer C.: Quantification of blood flow in brain tumors: comparison of arterial spin labeling and dynamic susceptibility-weighted contrast-enhanced MR imaging. Radiology 2003; 228: pp. 523-532.
23. Wolf R.L., Wang J., Wang S., et. al.: Grading of CNS neoplasms using continuous arterial spin labeled perfusion MR imaging at 3 Tesla. J Magn Reson Imaging 2005; 22: pp. 475-482.
24. Kimura H., Takeuchi H., Koshimoto Y., et. al.: Perfusion imaging of meningioma by using continuous arterial spin-labeling: comparison with dynamic susceptibility-weighted contrast-enhanced MR images and histopathologic features. AJNR Am J Neuroradiol 2006; 27: pp. 85-93.
25. Detre J.A., Alsop D.C., Vives L.R., et. al.: Noninvasive MRI evaluation of cerebral blood flow in cerebrovascular disease. Neurology 1998; 50: pp. 633-641.
26. Martirosian P., Klose U., Mader I., et. al.: FAIR true-FISP perfusion imaging of the kidneys. Magn Reson Med 2004; 51: pp. 353-361.
27. Boss A., Martirosian P., Schraml C., et. al.: Morphological, contrast-enhanced and spin labeling perfusion imaging for monitoring of relapse after RF ablation of renal cell carcinomas. Eur Radiol 2006; 16: pp. 1226-1236.
28. Lanzman R.S., Wittsack H.J., Martirosian P., et. al.: Quantification of renal allograft perfusion using arterial spin labeling MRI: initial results. Eur Radiol 2010; 20: pp. 1485-1491.
29. Kiefer C., Schroth G., Gralla J., et. al.: A feasibility study on model-based evaluation of kidney perfusion measured by means of FAIR prepared true-FISP arterial spin labeling (ASL) on a 3-T MR scanner. Acad Radiol 2009; 16: pp. 79-87.
30. Artz N.S., Sadowski E.A., Wentland A.L., et. al.: Reproducibility of renal perfusion MR imaging in native and transplanted kidneys using non-contrast arterial spin labeling. J Magn Reson Imaging 2011; 33: pp. 1414-1421.
31. Artz N.S., Sadowski E.A., Wentland A.L., et. al.: Arterial spin labeling MRI for assessment of perfusion in native and transplanted kidneys. Magn Reson Imaging 2011; 29: pp. 74-82.
32. Robson P.M., Madhuranthakam A.J., Dai W., et. al.: Strategies for reducing respiratory motion artifacts in renal perfusion imaging with arterial spin labeling. Magn Reson Med 2009; 61: pp. 1374-1387.
33. Gardener A.G., Francis S.T.: Multislice perfusion of the kidneys using parallel imaging: image acquisition and analysis strategies. Magn Reson Med 2010; 63: pp. 1627-1636.
34. Cutajar M., Thomas D.L., Banks T., et. al.: Repeatability of renal arterial spin labelling MRI in healthy subjects. MAGMA 2012; 25: pp. 145-153.
35. Gillis K.A., McComb C., Foster J.E., et. al.: Inter-study reproducibility of arterial spin labelling magnetic resonance imaging for measurement of renal perfusion in healthy volunteers at 3 Tesla. BMC Nephrol 2014; 15: pp. 23.
36. Heusch P., Wittsack H.J., Blondin D., et. al.: Functional evaluation of transplanted kidneys using arterial spin labeling MRI. J Magn Reson Imaging 2014; 40: pp. 84-89.
37. Heusch P., Wittsack H.J., Pentang G., et. al.: Biexponential analysis of diffusion-weighted imaging: comparison of three different calculation methods in transplanted kidneys. Acta Radiol 2013; 54: pp. 1210-1217.
38. Park S.H., Wang D.J., Duong T.Q.: Balanced steady state free precession for arterial spin labeling MRI: initial experience for blood flow mapping in human brain, retina, and kidney. Magn Reson Imaging 2013; 31: pp. 1044-1050.
39. Cutajar M., Hilton R., Olsburgh J., et. al.: Renal blood flow using arterial spin labelling MRI and calculated filtration fraction in healthy adult kidney donors pre-nephrectomy and post-nephrectomy. Eur Radiol 2015; 25: pp. 2390-2396.
40. Cutajar M., Thomas D.L., Hales P.W., et. al.: Comparison of ASL and DCE MRI for the non-invasive measurement of renal blood flow: quantification and reproducibility. Eur Radiol 2014; 24: pp. 1300-1308.
41. Dixon W.T., Sardashti M., Castillo M., et. al.: Multiple inversion recovery reduces static tissue signal in angiograms. Magn Reson Med 1991; 18: pp. 257-268.
42. Ye F.Q., Frank J.A., Weinberger D.R., et. al.: Noise reduction in 3D perfusion imaging by attenuating the static signal in arterial spin tagging (ASSIST). Magn Reson Med 2000; 44: pp. 92-100.
43. Rofsky N.M., Lee V.S., Laub G., et. al.: Abdominal MR imaging with a volumetric interpolated breath-hold examination. Radiology 1999; 212: pp. 876-884.
44. Sun M.R., Ngo L., Genega E.M., et. al.: Renal cell carcinoma: dynamic contrast-enhanced MR imaging for differentiation of tumor subtypes—correlation with pathologic findings. Radiology 2009; 250: pp. 793-802.
45. Dai W., Garcia D., de Bazelaire C., et. al.: Continuous flow-driven inversion for arterial spin labeling using pulsed radio frequency and gradient fields. Magn Reson Med 2008; 60: pp. 1488-1497.
46. Alsop D.C., Detre J.A.: Reduced transit-time sensitivity in noninvasive magnetic resonance imaging of human cerebral blood flow. J Cereb Blood Flow Metab 1996; 16: pp. 1236-1249.
47. Ordidge R.J., Wylezinska M., Hugg J.W., et. al.: Frequency offset corrected inversion (FOCI) pulses for use in localized spectroscopy. Magn Reson Med 1996; 36: pp. 562-566.
48. Maleki N., Dai W., Alsop D. A Systematic Approach to Optimizing Background Suppression for Arterial Spin Labeling Perfusion Imaging. Proc ISMRM 2008:1929.
49. de Bazelaire C.M., Duhamel G.D., Rofsky N.M., et. al.: MR imaging relaxation times of abdominal and pelvic tissues measured in vivo at 3.0 T: preliminary results. Radiology 2004; 230: pp. 652-659.
50. Roberts D.A., Detre J.A., Bolinger L., et. al.: Renal perfusion in humans: MR imaging with spin tagging of arterial water. Radiology 1995; 196: pp. 281-286.
51. Herscovitch P., Raichle M.E.: What is the correct value for the brain–blood partition coefficient for water?. J Cereb Blood Flow Metab 1985; 5: pp. 65-69.
52. Bjornerud A., Johansson L.O., Briley-Saebo K., et. al.: Assessment of T1 and T2* effects in vivo and ex vivo using iron oxide nanoparticles in steady state—dependence on blood volume and water exchange. Magn Reson Med 2002; 47: pp. 461-471.
53. Garcia D.M., Duhamel G., Alsop D.C.: Efficiency of inversion pulses for background suppressed arterial spin labeling. Magn Reson Med 2005; 54: pp. 366-372.
54. Busse R.F., Hariharan H., Vu A., et. al.: Fast spin echo sequences with very long echo trains: design of variable refocusing flip angle schedules and generation of clinical T2 contrast. Magn Reson Med 2006; 55: pp. 1030-1037.
55. Busse R.F., Brau A.C., Vu A., et. al.: Effects of refocusing flip angle modulation and view ordering in 3D fast spin echo. Magn Reson Med 2008; 60: pp. 640-649.
56. Martirosian P., Boss A., Fenchel M., et. al.: Quantitative lung perfusion mapping at 0.2 T using FAIR True-FISP MRI. Magn Reson Med 2006; 55: pp. 1065-1074.
57. McKenzie C.A., Yeh E.N., Ohliger M.A., et. al.: Self-calibrating parallel imaging with automatic coil sensitivity extraction. Magn Reson Med 2002; 47: pp. 529-538.
58. Roemer P.B., Edelstein W.A., Hayes C.E., et. al.: The NMR phased array. Magn Reson Med 1990; 16: pp. 192-225.
59. Robson P.M., Grant A.K., Madhuranthakam A.J., et. al.: Comprehensive quantification of signal-to-noise ratio and g-factor for image-based and k-space-based parallel imaging reconstructions. Magn Reson Med 2008; 60: pp. 895-907.
60. Han M., Beatty P.J., Daniel B.L., et. al.: Independent slab-phase modulation combined with parallel imaging in bilateral breast MRI. Magn Reson Med 2009; 62: pp. 1221-1231.