
Rationale and Objectives
New ways to understand biology as well as increasing interest in personalized treatments requires new capabilities for the assessment of therapy response. The lack of consensus methods and qualification evidence needed for large-scale multicenter trials, and in turn the standardization that allows them, are widely acknowledged to be the limiting factor in the deployment of qualified imaging biomarkers.
Materials and Methods
The Quantitative Imaging Biomarker Alliance is organized to establish a methodology whereby multiple stakeholders collaborate. It has charged the Volumetric Computed Tomography (CT) Technical Subcommittee with investigating the technical feasibility and clinical value of quantifying changes over time in either volume or other parameters as biomarkers. The group selected solid tumors of the chest in subjects with lung cancer as its first case in point. Success is defined as sufficiently rigorous improvements in CT-based outcome measures to allow individual patients in clinical settings to switch treatments sooner if they are no longer responding to their current regimens, and reduce the costs of evaluating investigational new drugs to treat lung cancer.
Results
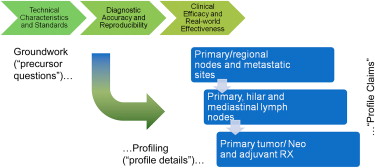
The team has completed a systems engineering analysis, has begun a roadmap of experimental groundwork, documented profile claims and protocols, and documented a process for imaging biomarker qualification as a general paradigm for qualifying other imaging biomarkers as well.
Conclusion
This report addresses a procedural template for the qualification of quantitative imaging biomarkers. This mechanism is cost-effective for stakeholders while simultaneously advancing the public health by promoting the use of measures that prove effective.
Efforts to develop public resources and open source tools for qualifying longitudinal volumetric computed tomography (CT) imaging as a biomarker were re-invigorated in 2005 by an informal alliance between the National Cancer Institute (NCI), the National Institute of Biomedical Imaging and Bioengineering (NIBIB), the National Institute of Standards and Technology (NIST) and the US Food and Drug Administration (FDA) . Preliminary work led to the organization of an inter-federal agency sponsored public workshop held at NIST headquarters in September 2006 . This workshop addressed the physical standards that would be required for qualifying medical imaging techniques as biomarkers. Stakeholders from academia, industry, regulatory agencies, patient advocacy groups, and scientific imaging societies participated. A model similar to the “Integrating the Healthcare Enterprise” (IHE) was endorsed as a means to organize and encourage collaboration among diverse stakeholders, given viable pathway for improving the success it has enjoyed. An alliance of this sort was thought to be necessary because the development of new or enhanced imaging technologies can be complex and expensive. Early phase justification of the costs, before commercial viability and medical value are established, can be difficult.
The Scientific Advisory Board of the Radiological Society of North America (RSNA) met in November 2006, and subsequently agreed to establish a “Quantitative Imaging Biomarker Alliance” (QIBA), modeled on the IHE process. One of the first three projects selected for piloting under the QIBA aegis was volumetric quantification at CT imaging.
Get Radiology Tree app to read full this article<
Objectives
Get Radiology Tree app to read full this article<
Get Radiology Tree app to read full this article<
Get Radiology Tree app to read full this article<
Get Radiology Tree app to read full this article<
Get Radiology Tree app to read full this article<
Steps taken to advance the field
Get Radiology Tree app to read full this article<
Get Radiology Tree app to read full this article<
Get Radiology Tree app to read full this article<
The IHE process
Get Radiology Tree app to read full this article<
Get Radiology Tree app to read full this article<
Get Radiology Tree app to read full this article<
Get Radiology Tree app to read full this article<
Get Radiology Tree app to read full this article<
The QIBA profiles for volumetric CT
Get Radiology Tree app to read full this article<
Get Radiology Tree app to read full this article<
Get Radiology Tree app to read full this article<
Get Radiology Tree app to read full this article<
Get Radiology Tree app to read full this article<
Get Radiology Tree app to read full this article<
Get Radiology Tree app to read full this article<
The QIBA volumetric CT validation roadmap
Get Radiology Tree app to read full this article<
Part 1: Static Image Sets
Get Radiology Tree app to read full this article<
Get Radiology Tree app to read full this article<
Get Radiology Tree app to read full this article<
Get Radiology Tree app to read full this article<
Get Radiology Tree app to read full this article<
Get Radiology Tree app to read full this article<
Get Radiology Tree app to read full this article<
Get Radiology Tree app to read full this article<
Get Radiology Tree app to read full this article<
Get Radiology Tree app to read full this article<
Get Radiology Tree app to read full this article<
Get Radiology Tree app to read full this article<
Get Radiology Tree app to read full this article<
Get Radiology Tree app to read full this article<
Get Radiology Tree app to read full this article<
Get Radiology Tree app to read full this article<
Get Radiology Tree app to read full this article<
Statistical Analyses
Get Radiology Tree app to read full this article<
Get Radiology Tree app to read full this article<
Table 1
Sample Size for 3 Paired Methods at α = 0.05 and 80%+ Power as a Function of the Minimum Detectable Difference and Standard Deviation (SD) within the Group
Minimum Detectable Difference (%) SD within group 1 5 10 20 1 51 4 3 2 5 335 51 15 6 10 335 188 51 15
Table 2
Sample Size for 5 Readers at α = 0.05 and 80%+ Power as a Function of the Minimum Detectable Difference and Standard Deviation (SD) within the Group
Minimum Detectable Difference (%) SD within group 1 5 10 20 1 66 5 3 2 5 202 66 18 6 15 202 202 66 18
Get Radiology Tree app to read full this article<
Get Radiology Tree app to read full this article<
Part 2: Setting Standards for Using Volumetric Imaging by Retrospectively Reanalyzing Results from Clinical Trials
Get Radiology Tree app to read full this article<
Get Radiology Tree app to read full this article<
Get Radiology Tree app to read full this article<
Get Radiology Tree app to read full this article<
Get Radiology Tree app to read full this article<
Table 3
Relationships between Categorical Responses Based on Line-lengths and their Corresponding Changes in Volume
Radius of Ball Longest Line-Length of Cube Δ Longest Line-Length Relative to Baseline Δ Volume Relative to Baseline Baseline 0.50 1.0 Progressive disease 0.60 1.2 20% 72.8% Partial response 0.35 0.7 -30% -65.7%
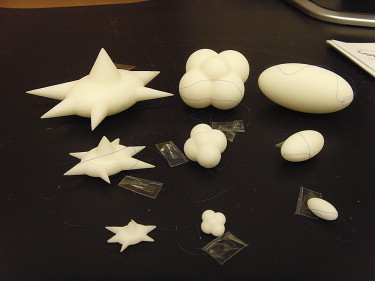
Typical relationships between line-lengths and volume measures for uniformly contracting or expanding balls (solid spheres) and cubes with longest diameters of 1 unit in length. For a ball, the radius is one-half the diameter. For a perfect cube, the longest line is the hypotenuse of a right triangle on its surface.
Get Radiology Tree app to read full this article<
Get Radiology Tree app to read full this article<
Get Radiology Tree app to read full this article<
Get Radiology Tree app to read full this article<
Diagnostic accuracy and reproducibility: addressed using new standards
Get Radiology Tree app to read full this article<
Get Radiology Tree app to read full this article<
Get Radiology Tree app to read full this article<
Get Radiology Tree app to read full this article<
End of the qualification roadmap: assessment of clinical efficacy and value
Get Radiology Tree app to read full this article<
Get Radiology Tree app to read full this article<
Get Radiology Tree app to read full this article<
Get Radiology Tree app to read full this article<
Get Radiology Tree app to read full this article<
Get Radiology Tree app to read full this article<
Get Radiology Tree app to read full this article<
Next steps…
Get Radiology Tree app to read full this article<
Get Radiology Tree app to read full this article<
Get Radiology Tree app to read full this article<
Acknowledgments
Get Radiology Tree app to read full this article<
Get Radiology Tree app to read full this article<
Get Radiology Tree app to read full this article<
References
1. Clarke L., Schilling L.B., Sriram R.D.: Imaging as a biomarker: standards for change measurements in therapy workshop summary. NIST Interagency Rep 2008; NISTIR7434:1
2. McLennan G., Clarke L.P., Hohl R.: Imaging as a biomarker for therapy response: cancer as a prototype for the creation of research resources. Clin Pharmacol Ther 2008; 84: pp. 433-436.
3. Armato S., Meyer C., McNitt-Gray M., et. al.: The Reference Image Database to Evaluate Response to Therapy in Lung Cancer (RIDER) project: a resource for the development of change-analysis software. Clin Pharmacol Ther 2008; 84: pp. 448-456.
4. Petrick N., Brown D.G., Suleiman O., et. al.: Imaging as a tumor biomarker in oncology drug trials for lung cancer: the FDA perspective. Clin Pharmacol Ther 2008; 4: pp. 523-525.
5. Gavrielides M.A., Kinnard L.M., Myers K.J., et. al.: Noncalcified lung nodules: volumetric assessment with thoracic CT. Radiology 2009; 251: pp. 26-37.
6. Buckler A. Volumetric CT: a potential biomarker of response. Drug information agency (DIA) meeting held on 3 October 2008 “Medical imaging continuum: path forward for advancing the uses of medical imaging in the development of new biopharmaceutical products.”
7. Eisenhauer E.Verweij J.Therasse P.Response assessment in solid tumours (RECIST): version 1.1 and supporting papers.2009. (2) 225–310
8. National Cancer Institute. Reference Image Database to Evaluate Response (RIDER). Available online at: http://gforge.nci.nih.gov/projects/rider/ . Accessed October 24, 2009.
9. Qualitative Imaging Biomarkers Allicance. Volumetric CT. Available online at: http://qibawiki.rsna.org/index.php?title=Volumetric_CT . Accessed October 24, 2009.
10. Prionas N.D., Ray S., Boone J.M., et. al.: Volume assessment accuracy in computed tomography: a phantom study. Journal of Investigative Medicine 2009; 57: pp. 50-96.
11. National Cancer Institute. National Biomedical Imaging Archive. Available online at: https://imaging.nci.nih.gov/ncia/ . Accessed October 24, 2009.
12. National Institute of Standards and Technology. Weights and measures inter-laboratory comparisons. Available online at: http://ts.nist.gov/WeightsAndMeasures/Metrology/roundrobins.cfm . Accessed October 24, 2009.
13. Jennings P., Aydin S., Bennett J., et. al.: Inter-laboratory comparison of human renal proximal tubule (HK-2) transcriptome alterations due to Cyclosporine A exposure and medium exhaustion. Toxicol In Vitro 2009; 23: pp. 486-499.
14. Information Technology Laboratory. Biochange 2008 pilot. Available online at: http://www.itl.nist.gov/iad/894.05/biochange2008/Biochange2008-webpage.htm . Accessed October 24, 2009.
15. Hsu J.: Multiple comparisons: theory and methods.1996.Chapman & HallLondon, UK
16. Chow S.C., Shao J., Wang H.: Sample size calculations in clinical research.2003.Marcel DekkerNew York
17. Department of Health and Human Services. Available online at: http://grants.nih.gov/grants/guide/pa-files/PAR-08-225.html . Accessed October 24, 2009.