
Rationale and Objectives
The purpose of this study was to evaluate the effect of various tube currents on the accuracy of volumetric measurements of ground-glass opacity (GGO) nodules using a chest phantom.
Materials and Methods
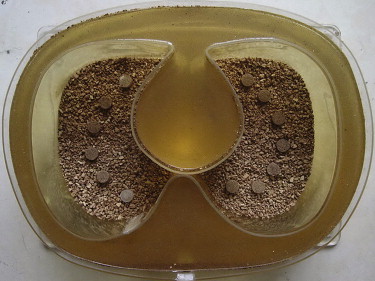
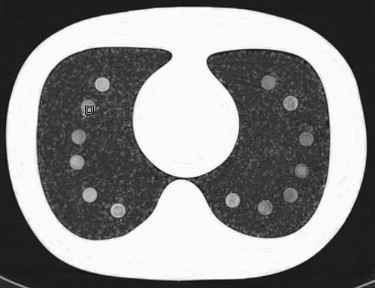
A chest phantom containing 13 artificial GGO nodules with known volumes was scanned using a 64-slice computed tomographic scanner at different tube currents (30, 60, 90, 120, 150, 180, and 210 mA). Volumetric measurements were performed using software. The relative percentage error and the absolute percentage error between the volume measures on computed tomography and the reference-standard volumes were calculated. Correlations between the mean absolute percentage error and the mean attenuation of nodules and between the ratio of solid component and the mean attenuation of nodules were analyzed.
Results
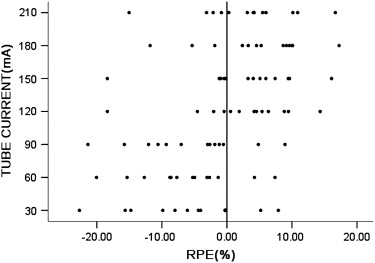
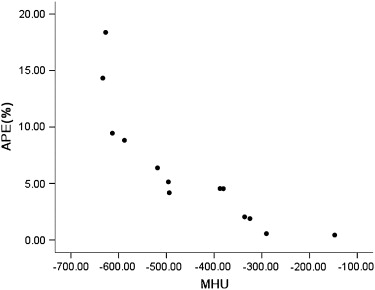
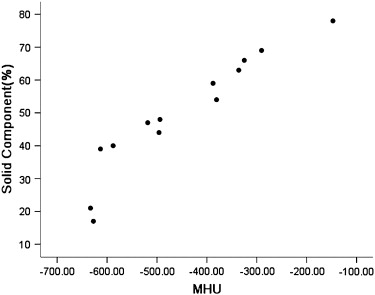
The relative percentage errors showed that there was substantial underestimation of nodule volumes at 30, 60, and 90 mA and substantial overestimation of volumes at 120, 150, 180, and 210 mA, but there was no statistically significant difference in absolute percentage errors ( P = .876). Pearson’s correlation coefficient of the mean absolute percentage errors of nodules on volumetric measurement versus the mean attenuation value of nodules showed a negative correlation, and the ratio of solid component to whole nodule versus the mean attenuation of nodules showed a positive correlation.
Conclusion
Volume measurement is a promising method for the quantification of GGO nodule volume. It is important to know that different tube currents can affect the accuracy of volumetric measurements.
Since the introduction of low-dose computed tomography for lung cancer screening, an increasing number of nodules with ground-glass opacity (GGO) have been detected . GGO is a nonspecific finding that may be caused by various disorders, including inflammatory disease, fibrosis, and neoplastic disease . Henschke et al reported that GGO nodules have a higher malignancy rate than solid nodules. In addition, the relationship between the proportion of ground-glass component in pulmonary adenocarcinoma and histologic features has recently been determined . In some reports , patients with ground-glass components of <50% had worse prognoses than those with ground-glass components of >50%. Therefore, quantitative analysis of GGO nodules is useful for both preoperative diagnosis and treatment planning.
Various methods for the measurement of ground-glass component have been reported. In many studies , the proportion of ground-glass component was semiquantified by visual estimation of the area in the lung window setting. In another report , both the diameter of nodules with ground-glass components and the central solid portions were measured instead of area. However, a limitation of current studies includes a lack of objectivity, and reproducibility in quantifying GGO nodules is highly dependent on the quality of computed tomographic (CT) images and on observers’ levels of experience. To reduce interobserver variability in the evaluation of GGO nodules and to allow for more accurate assessments, observer-independent analysis and objective measurement are necessary.
Get Radiology Tree app to read full this article<
Materials and methods
Phantom
Get Radiology Tree app to read full this article<
Get Radiology Tree app to read full this article<
Get Radiology Tree app to read full this article<
Determination of Reference-Standard GGO Nodule Volume
Get Radiology Tree app to read full this article<
CT Imaging
Get Radiology Tree app to read full this article<
Get Radiology Tree app to read full this article<
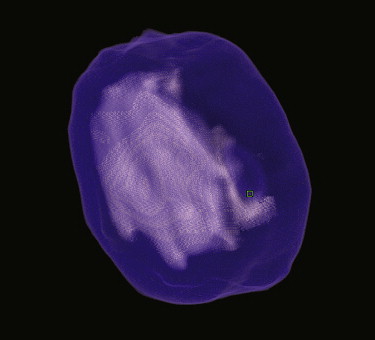
Nodule Volume Measurement on CT Images
Get Radiology Tree app to read full this article<
Data and Statistical Analysis
Get Radiology Tree app to read full this article<
Get Radiology Tree app to read full this article<
Get Radiology Tree app to read full this article<
Results
Get Radiology Tree app to read full this article<
Get Radiology Tree app to read full this article<
Get Radiology Tree app to read full this article<
Table 1
Mean APE and Mean RPE of Volume Measurements at Various Tube Currents
Tube Current (mA) Mean V m (mm 3 ) Pearson’s Correlation Coefficient ( P ) Mean APE (%) ∗ Mean RPE (%) 30 683.85 ± 109.20 0.811 (.001) 7.64 ± 6.71 −5.63 ± 8.60 60 679.69 ± 100.41 0.833 (.000) 7.85 ± 5.40 −6.07 ± 7.49 90 683.54 ± 91.02 0.759 (.003) 7.62 ± 6.24 −5.50 ± 8.31 120 740.46 ± 101.59 0.805 (.001) 6.23 ± 5.35 2.32 ± 8.05 150 744.08 ± 97.21 0.786 (.001) 6.31 ± 5.82 3.06 ± 8.18 180 756.23 ± 89.73 0.801 (.001) 7.64 ± 4.37 4.71 ± 7.63 210 746.46 ± 97.73 0.809 (.001) 6.31 ± 5.27 3.05 ± 7.79 Mean V rs 724.62 ± 94.38
APE, absolute percentage error; RPE, relative percentage error; V m , volume of nodule measured on computed tomography; V rs , reference-standard nodule volume.
Get Radiology Tree app to read full this article<
Get Radiology Tree app to read full this article<
Get Radiology Tree app to read full this article<
Get Radiology Tree app to read full this article<
Get Radiology Tree app to read full this article<
Table 2
Correlations Between the Mean Attenuation of Nodule and the Ratio of Solid Component and the APE
Tube Current (mA) Pearson’s Correlation Coefficient 30 60 90 120 150 180 210P % solid and MHU 0.901 0.938 0.942 0.945 0.914 0.928 0.941 .000 APE and MHU −0.832 −0.821 −0.844 −0.855 −0.850 −0.839 −0.853 .000
APE, absolute percentage error; MHU, mean attenuation value of nodule; % solid, ratio of solid component to whole nodule.
Get Radiology Tree app to read full this article<
Discussion
Get Radiology Tree app to read full this article<
Get Radiology Tree app to read full this article<
Get Radiology Tree app to read full this article<
Get Radiology Tree app to read full this article<
Get Radiology Tree app to read full this article<
Get Radiology Tree app to read full this article<
Get Radiology Tree app to read full this article<
References
1. Diederich S., Wormanns D., Semik M., et. al.: Screening for early lung cancer with low-dose spiral CT: prevalence in 817 asymptomatic smokers. Radiology 2002; 222: pp. 773-781.
2. Henschke C.I., Yankelevitz D.F., Mirtcheva R., et. al.: CT screening for lung cancer: frequency and significance of part-solid and nonsolid nodules. AJR Am J Roentgenol 2002; 178: pp. 1053-1057.
3. Kim H.Y., Shim Y.M., Lee K.S., et. al.: Persistent pulmonary nodular ground-glass opacity at thin-section CT: histopathologic comparisons. Radiology 2007; 245: pp. 267-275.
4. Park C.M., Goo J.M., Lee H.J., et. al.: Nodular ground-glass opacity at thin-section CT: histologic correlation and evaluation of change at follow-up. Radiographics 2007; 27: pp. 391-408.
5. Kuriyama K., Seto M., Kasugai T., et. al.: Ground-glass opacity on thin-section CT: value in differentiating subtypes of adenocarcinoma of the lung. AJR Am J Roentgenol 1999; 173: pp. 465-469.
6. Kim E.A., Johkoh T., Lee K.S., et. al.: Quantification of ground-glass opacity on high-resolution CT of small peripheral adenocarcinoma of the lung: pathologic and prognostic implications. AJR Am J Roentgenol 2001; 177: pp. 1417-1422.
7. Kodama K., Higashiyama M., Yokouchi H., et. al.: Natural history of pure ground-glass opacity after long-term follow-up of more than 2 years. Ann Thorac Surg 2002; 73: pp. 386-392.
8. Kodama K., Higashiyama M., Yokouchi H., et. al.: Prognostic value of ground-glass opacity found in small lung adenocarcinoma on high-resolution CT scanning. Lung Cancer 2001; 33: pp. 17-25.
9. Matsuguma H., Nakahara R., Anraku M., et. al.: Objective definition and measurement method of ground-glass opacity for planning limited resection in patients with clinical stage IA adenocarcinoma of the lung. Eur J Cardiothorac Surg 2004; 25: pp. 1102-1106.
10. Aoki T., Tomoda Y., Watanabe H., et. al.: Peripheral lung adenocarcinoma: correlation of thin-section CT findings with histologic prognostic factors and survival. Radiology 2001; 220: pp. 803-809.
11. Jennings S.G., Winer-Muram H.T., Tarver R.D., et. al.: Lung tumor growth: assessment with CT—comparison of diameter and cross-sectional area with volume measurements. Radiology 2004; 231: pp. 866-871.
12. Yankelevitz D.F., Reeves A.P., Kostis W.J., et. al.: Small pulmonary nodules: volumetrically determined growth rates based on CT evaluation. Radiology 2000; 217: pp. 251-256.
13. Ravenel J.G., Leue W.M., Nietert P.J., et. al.: Pulmonary nodule volume: effects of reconstruction parameters on automated measurements—a phantom study. Radiology 2008; 247: pp. 400-408.
14. Marten K., Funke M., Engelke C.: Flat panel detector-based volumetric CT: prototype evaluation with volumetry of small artificial nodules in a pulmonary phantom. J Thorac Imaging 2004; 19: pp. 156-163.
15. Lee K.W., Im J.G., Kim T.J., et. al.: A new method of measuring the amount of soft tissue in pulmonary ground-glass opacity nodules: a phantom study. Korean J Radiol 2008; 9: pp. 219-225.
16. Goo J.M., Tongdee T., Tongdee R., et. al.: Volumetric measurement of synthetic lung nodules with multi-detector row CT: effect of various image reconstruction parameters and segmentation thresholds on measurement accuracy. Radiology 2005; 235: pp. 850-856.
17. Kostis W.J., Yankelevitz D.F., Reeves A.P., et. al.: Small pulmonary nodules: reproducibility of three-dimensional volumetric measurement and estimation of time to follow-up CT. Radiology 2004; 231: pp. 446-452.
18. Brenner D.J.: Radiation risks potentially associated with low-dose CT screening of adult smokers for lung cancer. Radiology 2004; 231: pp. 440-445.
19. Brenner D.J., Elliston C.D.: Estimated radiation risks potentially associated with full-body CT screening. Radiology 2004; 232: pp. 735-738.
20. Zwirewich C.V., Mayo J.R., Müller N.L.: Low-dose high-resolution CT of lung parenchyma. Radiology 1991; 180: pp. 413-417.
21. Liu D., Awai K., Funama Y., et. al.: Identification and characterization of focal ground-glass opacity in the lungs by high-resolution CT using thin-section multidetector helical CT: experimental study using a chest CT phantom. Radiat Med 2008; 26: pp. 21-27.
22. Ko J.P., Rusinek H., Jacobs E.L., et. al.: Small pulmonary nodules: volume measurement at chest CT—phantom study. Radiology 2003; 228: pp. 864-870.
23. Kakinuma R., Ohmatsu H., Kaneko M., et. al.: Progression of focal pure ground-glass opacity detected by low-dose helical computed tomography screening for lung cancer. J Comput Assist Tomogr 2004; 28: pp. 17-23.
24. Sumikawa H., Johkoh T., Nagareda T., et. al.: Pulmonary adenocarcinomas with ground-glass attenuation on thin-section CT: quantification by three-dimensional image analyzing method. Eur J Radiol 2008; 65: pp. 104-111.