
Objectives
Plexiform neurofibromas (PNs) are complex, histologically benign peripheral nerve sheath tumors that are challenging to measure by simple line measurements. Computer-aided volumetric segmentation of PN has become the recommended method to assess response in clinical trials directed at PN. Different methods for volumetric analysis of PN have been developed. The goal of this study is to test the level of agreement in volume measurements and in interval changes using two separate methods of volumetric magnetic resonance imaging analysis.
Methods
Three independent volume measurements were performed on 15 PN imaged at three time-points using 3DQI software at Massachusetts General Hospital (MGH) and National Cancer Institute (NCI) and MEDx software at NCI.
Results
Median volume differences at each time-point comparing MGH-3DQI and NCI-3DQI were −0.5, −4.2, and −19.9 mL; comparing NCI-3DQI and NCI-MEDx were −21.0, −47.0, and −21.0 mL; comparing MGH-3DQI and NCI-MEDx were −10.0, −70.3, and −29.9 mL. Median differences in percentage change over time comparing MGH-3DQI and NCI-3DQI were −1.7, 1.1, and −1.0%; comparing NCI-3DQI and NCI-MEDx were −2.3, 3.3, and −1.1%; comparing MGH-3DQI and NCI-MEDx were −0.4, 2.0, and −1.5%. Volume differences were <20% of the mean of the two measurements in 117 of 135 comparisons (86.7%). Difference in interval change was <20% in 120 of the 135 comparisons (88.9%), while disease status classification was concordant in 115 of 135 comparisons (85.2%).
Conclusions
The volumes, interval changes, and progression status classifications were in good agreement. The comparison of two volumetric analysis methods suggests no systematic differences in tumor assessment. A prospective comparison of the two methods is planned.
Introduction
Plexiform neurofibromas (PNs) are histologically benign nerve sheath tumors typically associated with neurofibromatosis type-1 (NF1). These tumors develop along multiple branches of peripheral nerves and can be large, or irregularly shaped, making standard linear measurements unreliable. PNs are well visualized by magnetic resonance imaging (MRI) using short tau inversion recovery (STIR) sequence, and can be contoured using computer-aided volumetric lesion segmentation methods . Volumetric evaluation has become the method of choice to determine tumor response and time to disease progression in recent clinical trials for NF1-related PNs .
In the phase 1 trial of the MEK inhibitor selumetinib, 71% of patients with inoperable PN experienced at least 20% volume reduction, and in some cases, improvement in clinical symptoms . If the ongoing phase 2 trial confirms a similar response rate and proves that the moderate size decreases are indeed associated with clinical improvement, selumetinib may become the first medical therapy approved by the US Food and Drug Administration (FDA) for the treatment of PN.
Get Radiology Tree app to read full this article<
Get Radiology Tree app to read full this article<
Get Radiology Tree app to read full this article<
Get Radiology Tree app to read full this article<
Methods
Patients
Get Radiology Tree app to read full this article<
Get Radiology Tree app to read full this article<
MRI Acquisition
Get Radiology Tree app to read full this article<
Image Analysis
Get Radiology Tree app to read full this article<
Get Radiology Tree app to read full this article<
Get Radiology Tree app to read full this article<
Statistical Analysis
Get Radiology Tree app to read full this article<
Get Radiology Tree app to read full this article<
Results
Get Radiology Tree app to read full this article<
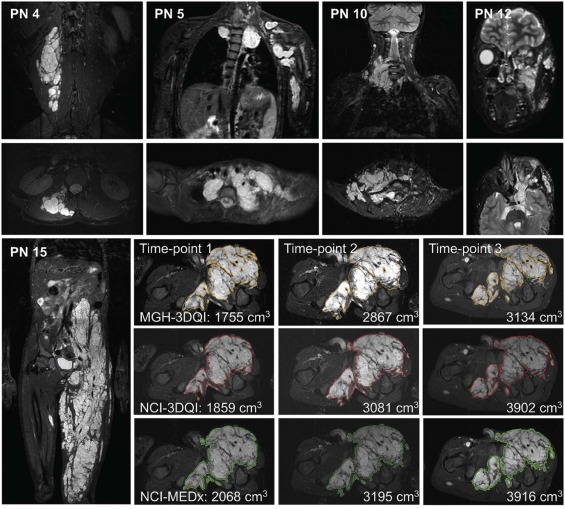
Table 1
Three Independent Volumetric MRI Measurements of 15 PN Imaged at Three Different Time-points
ID PN Location Time-point 1 MRI Time-point 2 MRI Time-point 3 MRI MGH-3DQI NCI-3DQI NCI-MEDx MGH-3DQI NCI-3DQI NCI-MEDx MGH-3DQI NCI-3DQI NCI-MEDx 1 Abdomen 2568.7 3013 3302 4204.5 4127 4533 4724.3 4930 5150 2 Neck, chest 588.2 599 647 682.7 674 753 743.6 746 818 3 Neck, chest 893.0 824 892 1112.1 1087 1244 1399.5 1380 1425 4 Back 129.4 126 147 137.3 135 150 151.7 149 170 5 Brachial plexus 359.0 444 591 421.1 514 659 527.6 657 771 6 Chest 1861.3 1856 1838 1938.9 1964 2030 2253.1 2273 2283 7 Chest, left arm 1243.0 1426 1564 1377.9 1690 1820 1880.8 2060 2287 8 Face 180.1 155 177 175.7 173 181 204.8 194 201 9 Lower leg 255.4 285 270 299.1 329 328 270.5 303 290 10 Neck 152.0 151 162 175.8 180 188 257.7 256 288 11 Orbit 91.8 88.3 87.8 82.2 96.7 106 63.0 76.7 79.3 12 Orbit, face 175.1 180 168 211.4 201 194 241.9 200 194 13 Pelvis 987.5 988 970 993.8 1086 1133 1098.5 1146 1196 14 Abdomen, pelvis 1021.2 868 836 1634.6 1311 1282 2864.1 2949 2835 15 Pelvis, thigh 1755.2 1859 2068 2867.2 3081 3195 3134.1 3902 3916
MGH, Massachusetts General Hospital; MRI, magnetic resonance imaging; NCI, National Cancer Institute; PN, plexiform neurofibroma.
The customary reporting style at MGH is to give all values with decimals, whereas at NCI volumes over 100 mL are rounded to the nearest whole. The smallest volume in the dataset is 63.0 mL (PN11, MGH-3DQI, time-point 3), and the largest volume is 5150 mL (PN1, NCI-MEDx, time-point 3). Volume trends by age are provided in Supplementary Fig S1 .
Get Radiology Tree app to read full this article<
Get Radiology Tree app to read full this article<
Table 2
Summary of Volume Measurement Differences
A. Volumes Time-point 1 MRI Time-point 2 MRI Time-point 3 MRI MGH-3DQI—NCI-3DQI Volume difference:
Median (range) mL* −0.5
(−444.3 to 153.2)
P = .45 −4.2
(−312.1 to 323.6)
P = .42 −19.9
(−767.9 to 41.9)
P = .035 *Corresponding relative volume difference—% of mean (PN ID) 0.1 (PN13)
15.9 (PN1); 16.2 (PN14) 2.4 (PN10)
20.3 (PN7); 22.0 (PN14) 0.9 (PN6)
21.8 (PN15); 19.0 (PN12) Relative volume difference
Median (range)—% of mean** 5.7
(0.1–21.2) 5.0
(1.3–22.0) 4.3
(0.3–21.8) **Corresponding absolute volume difference—mL (PN ID) 103.8 (PN15)
0.5 (PN13); 85.0 (PN5) 10.4 (PN12)
8.7 (PN2); 323.6 (PN14) 205.7 (PN1)
2.4 (PN2); 767.9 (PN15) Number of PN with <20% relative volume difference 14 13 13 NCI-3DQI—NCI-MEDx Volume difference:
Median (range)—mL* −21.0
(−289.0 to 32.0)
P = .071 −47.0
(−406.0 to 29.0)
P = .0024 −21.0
(−227.0 to 114.0)
P = .018 *Corresponding relative volume difference—% of mean (PN ID) 15.4 (PN4)
9.2 (PN1); 3.8 (PN14) 4.2 (PN13)
24.7 (PN1); 2.2 (PN14) 13.2 (PN4)
10.4 (PN7); 3.9 (PN14) Relative volume difference
Median (range)—% of mean** 7.7
(0.6–28.4) 4.5
(0.3–24.7) 4.3
(0.4–16.0) **Corresponding absolute volume difference—mL (PN ID) 48.0 (PN2)
0.5 (PN11); 147.0 (PN5) 8.0 (PN8)
1.0 (PN9); 145.0 (PN5) 50.0 (PN13)
10.0 (PN6); 114.0 (PN5) Number of PN with <20% relative volume difference 14 14 15 MGH-3DQI—NCI-MEDx Volume difference:
Median (range)—mL* −10.0
(−733.3 to 185.2)
P = .21 −70.3
(−442.1 to 352.6)
P = .015 −29.9
(−781.9 to 47.9)
P = .010 *Corresponding relative volume difference—% of mean (PN ID) 6.4 (PN10)
25.0 (PN1); 19.9 (PN14) 9.8 (PN2)
27.6 (PN7); 24.2 (PN14) 1.3 (PN6)
22.2 (PN15); 22.0 (PN12) Relative volume difference
Median (range)—% of mean** 6.4
(0.1–48.8) 9.8
(3.0–44.0) 9.5
(1.0–37.5) **Corresponding absolute volume difference—mL (PN ID) 10.0 (PN10)
1.0 (PN3); 232.0 (PN5) 70.3 (PN2)
5.3 (PN8); 237.9 (PN5) 74.4 (PN2)
29.1 (PN14); 243.4 (PN5) Number of PN with <20% relative volume difference 12 11 11
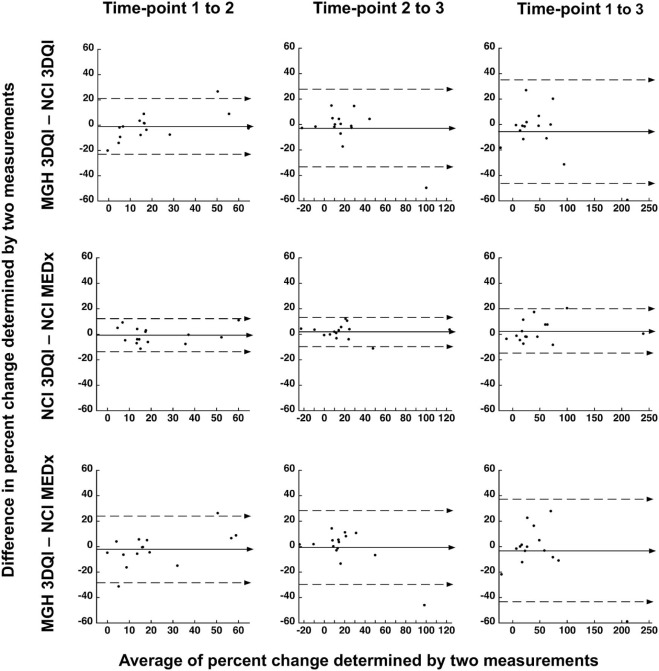
B. Interval Changes Time-points 1–2 Time-points 2–3 Time-points 1–3 MGH-3DQI—NCI-3DQI Difference in % change
Median (range)—% −1.7
(−20.0 to 26.7)
P = .56 1.1
(−49.7 to 14.9)
P = .80 −1.0
(−59.3 to 27.0)
P = .27 Largest discrepancy in interval change—% (PN ID) 63.7 vs 37.0
(PN1) 75.2 vs 124.9
(PN14) 180.5 vs 239.7
(PN14) Number of PN with <20% difference in interval change 13 14 11 Number of PN with concordant disease status assessment 14 14 12 NCI-3DQI—NCI-MEDx Difference in % change
Median (range)—% −2.3
(−11.2 to 11.2)
P = .60 3.3
(−11.0 to 12.4),
P = .095 −1.1
(−8.2 to 20.5)
P = .60 Largest discrepancy in interval change—% (PN ID) 65.7 vs 54.5
(PN15) 27.0 vs 14.5
(PN3) 109.9 vs 89.4
(PN15) Number of PN with <20% difference in interval change 15 15 14 Number of PN with concordant disease status assessment 13 13 13 MGH-3DQI—NCI-MEDx Difference in % change
Median (range)—% −0.4
(−31.2 to 26.4)
P = .68 2.0
(−45.9 to 14.4)
P = .39 −1.5
(−58.7 to 28.0)
P = .64 Largest discrepancy in interval change—% (PN ID) −10.5 vs 20.7
(PN11) 75.2 vs 121.1
(PN14) 180.5 vs 239.1
(PN14) Number of PN with <20% difference in interval change 13 14 11 Number of PN with concordant disease status assessment 12 12 12
MGH, Massachusetts General Hospital; MRI, magnetic resonance imaging; NCI, National Cancer Institute; PN ID, plexiform neurofibromas identification.
In large tumors, absolute volume differences tend to be greater, but in proportion to their size smaller lesions can have more measurement discrepancy; therefore, we provide both the numeric and relative differences. The volume differences were calculated by subtracting one volume from the matching other, as listed in the header, and ranged from −781.9 mL (PN15, MGH3DQI vs NCI-MEDx, time-point 3) to 406.0 mL (PN1, MGH-3DQI vs NCI-3DQI, time-point 2). Relative volume differences were calculated using the absolute volume differences between the matching pairs (irrespective of negative or positive values), and comparing to the mean of the same pairs. PN ID refers to the lesion identification as listed in Table 1 .
Get Radiology Tree app to read full this article<
Get Radiology Tree app to read full this article<
Get Radiology Tree app to read full this article<
Get Radiology Tree app to read full this article<
Get Radiology Tree app to read full this article<
Get Radiology Tree app to read full this article<
Get Radiology Tree app to read full this article<
Get Radiology Tree app to read full this article<
Discussion
Get Radiology Tree app to read full this article<
Get Radiology Tree app to read full this article<
Get Radiology Tree app to read full this article<
Get Radiology Tree app to read full this article<
Get Radiology Tree app to read full this article<
Get Radiology Tree app to read full this article<
Get Radiology Tree app to read full this article<
Get Radiology Tree app to read full this article<
Get Radiology Tree app to read full this article<
Get Radiology Tree app to read full this article<
Get Radiology Tree app to read full this article<
Get Radiology Tree app to read full this article<
Get Radiology Tree app to read full this article<
Get Radiology Tree app to read full this article<
Supplementary Data
Get Radiology Tree app to read full this article<
Figure S1
Get Radiology Tree app to read full this article<
Get Radiology Tree app to read full this article<
Get Radiology Tree app to read full this article<
Figure S2
Get Radiology Tree app to read full this article<
Get Radiology Tree app to read full this article<
Get Radiology Tree app to read full this article<
Figure S3
Get Radiology Tree app to read full this article<
Get Radiology Tree app to read full this article<
Get Radiology Tree app to read full this article<
References
1. Cai W., Kassarjian A., Bredella M.A., et. al.: Tumor burden in patients with neurofibromatosis types 1 and 2 and schwannomatosis: determination on whole-body MR images. Radiology 2009; 250: pp. 665-673.
2. Solomon J., Warren K., Dombi E., et. al.: Automated detection and volume measurement of plexiform neurofibromas in neurofibromatosis 1 using magnetic resonance imaging. Comput Med Imaging Graph 2004; 28: pp. 257-265.
3. Poussaint T.Y., Jaramillo D., Chang Y., et. al.: Interobserver reproducibility of volumetric MR imaging measurements of plexiform neurofibromas. AJR Am J Roentgenol 2003; 180: pp. 419-423.
4. Dombi E., Baldwin A., Marcus L.J., et. al.: Activity of selumetinib in neurofibromatosis type 1-related plexiform neurofibromas. N Engl J Med 2016; 375: pp. 2550-2560.
5. Robertson K.A., Nalepa G., Yang F.C., et. al.: Imatinib mesylate for plexiform neurofibromas in patients with neurofibromatosis type 1: a phase 2 trial. Lancet Oncol 2012; 13: pp. 1218-1224.
6. Weiss B., Widemann B.C., Wolters P., et. al.: Sirolimus for progressive neurofibromatosis type 1-associated plexiform neurofibromas: a neurofibromatosis Clinical Trials Consortium phase II study. Neuro Oncol 2015; 17: pp. 596-603.
7. Weiss B., Widemann B.C., Wolters P., et. al.: Sirolimus for non-progressive NF1-associated plexiform neurofibromas: an NF clinical trials consortium phase II study. Pediatr Blood Cancer 2014; 61: pp. 982-986.
8. Widemann B.C., Babovic-Vuksanovic D., Dombi E., et. al.: Phase II trial of pirfenidone in children and young adults with neurofibromatosis type 1 and progressive plexiform neurofibromas. Pediatr Blood Cancer 2014; 61: pp. 1598-1602.
9. Widemann B.C., Dombi E., Gillespie A., et. al.: Phase 2 randomized, flexible crossover, double-blinded, placebo-controlled trial of the farnesyltransferase inhibitor tipifarnib in children and young adults with neurofibromatosis type 1 and progressive plexiform neurofibromas. Neuro Oncol 2014; 16: pp. 707-718.
10. Plotkin S.R., Blakeley J.O., Dombi E., et. al.: Achieving consensus for clinical trials: the REiNS International Collaboration. Neurology 2013; 81: pp. S1-S5.
11. Dombi E., Ardern-Holmes S.L., Babovic-Vuksanovic D., et. al.: Recommendations for imaging tumor response in neurofibromatosis clinical trials. Neurology 2013; 81: pp. S33-S40.
12. Eisenhauer E.A., Therasse P., Bogaerts J., et. al.: New response evaluation criteria in solid tumours: revised RECIST guideline (version 1.1). Eur J Cancer 2009; 45: pp. 228-247.
13. Miller A.B., Hoogstraten B., Staquet M., et. al.: Reporting results of cancer treatment. Cancer 1981; 47: pp. 207-214.
14. Zhao B., James L.P., Moskowitz C.S., et. al.: Evaluating variability in tumor measurements from same-day repeat CT scans of patients with non-small cell lung cancer. Radiology 2009; 252: pp. 263-272.
15. Yoon S.H., Kim K.W., Goo J.M., et. al.: Observer variability in RECIST-based tumour burden measurements: a meta-analysis. Eur J Cancer 2016; 53: pp. 5-15.
16. Oxnard G.R., Zhao B., Sima C.S., et. al.: Variability of lung tumor measurements on repeat computed tomography scans taken within 15 minutes. J Clin Oncol 2011; 29: pp. 3114-3119.
17. Ford R., Schwartz L., Dancey J., et. al.: Lessons learned from independent central review. Eur J Cancer 2009; 45: pp. 268-274.
18. Buckler A.J., Danagoulian J., Johnson K., et. al.: Inter-method performance study of tumor volumetry assessment on computed tomography test-retest data. Acad Radiol 2015; 22: pp. 1393-1408.
19. Dejaco D., Url C., Schartinger V.H., et. al.: Approximation of head and neck cancer volumes in contrast enhanced CT. Cancer Imaging 2015; 15: pp. 16.
20. Nishino M., Guo M., Jackman D.M., et. al.: CT tumor volume measurement in advanced non-small-cell lung cancer: performance characteristics of an emerging clinical tool. Acad Radiol 2011; 18: pp. 54-62.