
Rationale and Objectives
For mechanical ventilation of patients with pulmonary injuries, it has been proposed that high-frequency oscillatory ventilation (HFOV) offers advantages over conventional ventilation (CV); however, these advantages have been difficult to quantify. We used volumetric, dynamic imaging of Xenon (Xe) washout of the canine lung during both HFOV and CV to compare regional ventilation in the two modalities.
Materials and Methods
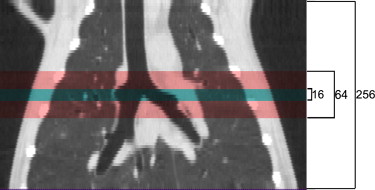
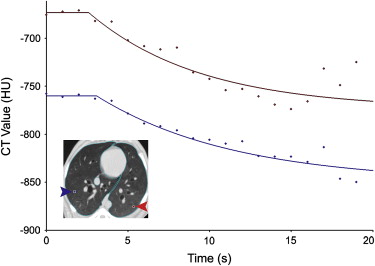
Three anesthetized, mechanically ventilated animals were studied, each at three different ventilator settings. Imaging was performed on an experimental Toshiba 256-slice scanner at 80 kV, 250 mAs, and 0.5-second scans, yielding 12.8 cm of Z-axis coverage. Repeated images were acquired at increasing intervals between 1 and 10 seconds for 90 seconds during HFOV and using retrospective respiratory gating to end-expiration for 60 seconds during CV. Image series were analyzed to quantify regional specific ventilation (s V˙ V
˙ ) from the regional density washout time constants.
Results
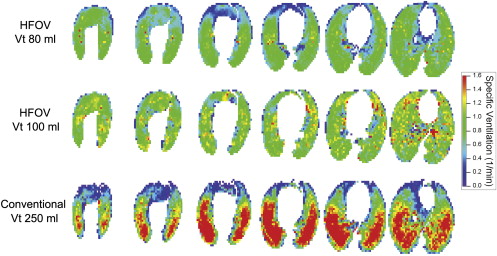
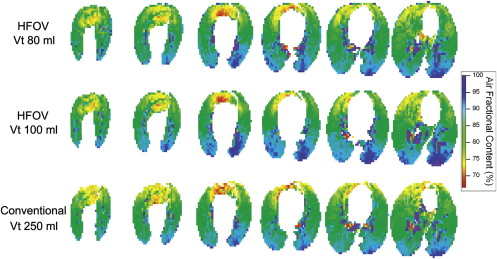
High-quality, high-resolution regional ventilation maps were obtained during both CV and HFOV. Overall ventilation decreased at smaller tidal volume, as expected. Regional s V˙ V
˙ was more uniform during HFOV compared to CV, but the underlying distribution of lung aeration was similar.
Conclusions
High-resolution volumetric ventilation maps of the lung may be obtained with the 256-slice multidetector computed tomographic scanner. There is a marked difference in the distribution of regional ventilation between CV and HFOV, with a significant gravitational ventilation gradient in CV that was not present during HFOV. This technique may be useful in exploring the mechanisms by which HFOV improves gas exchange.
Functional lung imaging with x-ray computed tomography facilitates the study of pulmonary structure–function relationships by providing both detailed anatomic information as well as co-localized physiologic information . As the speed and volumetric coverage of multidetector computed tomographic (CT) scanners has increased over time, so has the ability to rapidly and efficiently characterize variation in regional lung function across the entire lung. Recently, volumetric CT image acquisition took a giant leap with the introduction of the Toshiba Aquilion One scanner, a multidetector CT scanner capable of acquiring 320 contiguous 0.5-mm thick axial slices in a single 0.33-second rotation, making true volumetric CT imaging commercially available. We had an opportunity to test a preproduction 256-slice version of this scanner to evaluate its potential for studying the distribution of pulmonary gas exchange during high-frequency oscillatory ventilation (HFOV), a novel form of mechanical ventilation with application in management of patients with refractory acute lung injury .
For mechanical ventilation of patients with pulmonary injuries, it has been proposed that HFOV offers advantages over conventional ventilation (CV); however, the physiology of HFOV remains poorly characterized . In contrast to CV, which delivers breaths that mimic normal breathing with volumes of 400–900 mL at 6–30 breaths/minute, HFOV delivers breaths of 40–150 mL at 180–900 breaths/minute (3–15 Hz). The rationale behind this approach is that by ventilating with smaller breaths at an elevated mean lung volume, it may be possible to avoid the injurious extremes of lung overdistention and collapse that can arise from the large volume excursions applied to the stiff, injured lung during CV . Because the tidal volume in HFOV is smaller than the anatomic dead space (the volume of the conducting airways leading to the gas-exchanging alveolar region), the methods of gas exchange and, further, the factors governing the distribution of ventilation, are distinctly different from those in CV. It has been difficult to directly measure these differences in intact subjects.
Get Radiology Tree app to read full this article<
Get Radiology Tree app to read full this article<
Materials and methods
Animal Preparation
Get Radiology Tree app to read full this article<
Get Radiology Tree app to read full this article<
Experimental Protocol
Get Radiology Tree app to read full this article<
Table 1
Ventilator Settings
Subject Conventional Ventilation High-Frequency Ventilation RR (breaths/min) Vt (mL) PEEP (cm H 2 O) ƒ (Hz) Vt (mL) MAP (cm H 2 O) 1 10 60 10 10 80 10 10 100 10 2 30 220 7.5 30 400 7.5 30 400 0 3 30 250 7.5 10 80 10 10 100 10
MAP, mean airway pressure; PEEP, positive end-expiratory pressure; RR, respiratory rate; Vt, tidal volume.
Each animal was imaged at a total of three high-frequency oscillatory ventilation and/or conventional ventilator settings.
Get Radiology Tree app to read full this article<
Imaging
Get Radiology Tree app to read full this article<
Get Radiology Tree app to read full this article<
Get Radiology Tree app to read full this article<
Image Analysis
Get Radiology Tree app to read full this article<
Get Radiology Tree app to read full this article<
Get Radiology Tree app to read full this article<
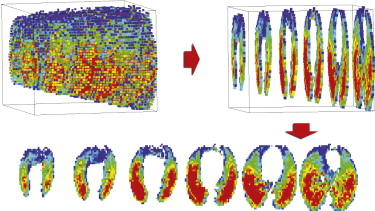
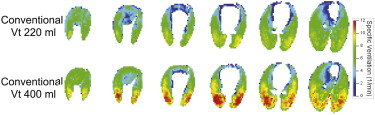
Table 2
Measures of Ventilation Heterogeneity
Stepwise Linear Regression r 2 HFOV CV Y 0.028 ± 0.03 0.294 ± 0.12 Y/Z 0.040 ± 0.02 0.296 ± 0.12 Y/Z/S 0.042 ± 0.02 0.298 ± 0.12
Coefficients of Variation HFOV CV Total: COV t 0.41 ± 0.06 0.46 ± 0.12 Other: COV i 0.40 ± 0.06 0.38 ± 0.12 Y only: COV y 0.09 ± 0.03 0.25 ± 0.04 ∗
CV, conventional ventilation; HFOV, high-frequency oscillatory ventilation; S , side (left vs. right); SD, standard deviation; Y , dorsal-ventral (vertical) height; Z , coronal location (apex-base).
Means ± SD; n = 5 HFOV, n = 4 CV.
Get Radiology Tree app to read full this article<
Get Radiology Tree app to read full this article<
Results
Get Radiology Tree app to read full this article<
Get Radiology Tree app to read full this article<
Get Radiology Tree app to read full this article<
Get Radiology Tree app to read full this article<
Discussion
Get Radiology Tree app to read full this article<
Get Radiology Tree app to read full this article<
Get Radiology Tree app to read full this article<
Get Radiology Tree app to read full this article<
Get Radiology Tree app to read full this article<
Conclusions
Get Radiology Tree app to read full this article<
Acknowledgments
Get Radiology Tree app to read full this article<
Get Radiology Tree app to read full this article<
References
1. Hoffman E.A., Simon B.A., McLennan G.: State of the art. A structural and functional assessment of the lung via multidetector-row computed tomography: phenotyping chronic obstructive pulmonary disease. Proc Am Thorac Soc 2006; 3: pp. 519-532.
2. Simon B.A., Christensen G.E., Low D.A., et. al.: Computed tomography studies of lung mechanics. Proc Am Thoracic Soc 2005; 2: pp. 517-521. 506–507
3. Krishnan J.A., Brower R.G.: High-frequency ventilation for acute lung injury and ARDS. Chest 2000; 118: pp. 795-807.
4. Hager D.N., Fessler H.E., Kaczka D.W., et. al.: Tidal volume delivery during high-frequency oscillatory ventilation in adults with acute respiratory distress syndrome. Crit Care Med 2007; 35: pp. 1522-1529.
5. Chon D., Simon B.A., Beck K.C., et. al.: Differences in regional wash-in and wash-out time constants for xenon-CT ventilation studies. Respir Physiol Neurobiol 2005; 148: pp. 65-83.
6. Marcucci C., Nyhan D., Simon B.A.: Distribution of pulmonary ventilation using Xe-enhanced computed tomography in prone and supine dogs. J Appl Physiol 2001; 90: pp. 421-430.
7. Simon B.A., Mitzner W.: Design and calibration of a high-frequency oscillatory ventilator. IEEE Trans Biomed Eng 1991; 38: pp. 214-218.
8. Fuld M.K., Easley R.B., Saba O.I., et. al.: CT-measured regional specific volume change reflects regional ventilation in supine sheep. J Appl Physiol 2008; 104: pp. 1177-1184.
9. Treppo S., Mijailovich S.M., Venegas J.G.: Contributions of pulmonary perfusion and ventilation to heterogeneity in V(A)/Q measured by PET. J Appl Physiol 1997; 82: pp. 1163-1176.
10. Hoffman E.A., Sinak L.J., Robb R.A., et. al.: Noninvasive quantitative imaging of shape and volume of lungs. J Appl Physiol 1983; 54: pp. 1414-1421.
11. Hoffman E.A.: Effect of body orientation on regional lung expansion: a computed tomographic approach. J Appl Physio 1985; 59: pp. 468-480.
12. Hoffman E.A., Ritman E.L.: Invariant total heart volume in the intact thorax. Am J Physiol 1985; 249: pp. H883-H890.
13. Hoffman E.A., Ritman E.L.: Heart-lung interaction: effect on regional lung air content and total heart volume. Ann Biomed Eng 1987; 15: pp. 241-257.
14. Liu Y.H., Hoffman E.A., Ritman E.L.: Measurement of three-dimensional anatomy and function of pulmonary arteries with high-speed x-ray computed tomography. Invest Radiol 1987; 22: pp. 28-36.
15. Hoffman E.A., Chon D.: Computed tomography studies of lung ventilation and perfusion. Proc Am Thorac Soc 2005; 2: pp. 492-498. 506
16. Simon B.A.: Regional ventilation and lung mechanics using X-ray CT. Acad Radiol 2005; 12: pp. 1414-1422.
17. Chon D., Beck K.C., Simon B.A., et. al.: Effect of low-xenon and krypton supplementation on signal/noise of regional CT-based ventilation measurements. J Appl Physiol 2007; 102: pp. 1535-1544.
18. Chon D., Beck K.C., Larsen R.L., et. al.: Regional pulmonary blood flow in dogs by 4D-X-ray CT. J Appl Physiol 2006; 101: pp. 1451-1465.
19. Uppaluri R., Mitsa T., Sonka M., et. al.: Quantification of pulmonary emphysema from lung computed tomography images. Am J Respir Crit Care Med 1997; 156: pp. 248-254.
20. Uppaluri R., Hoffman E.A., Sonka M., et. al.: Computer recognition of regional lung disease patterns. Am J Respir Crit Care Med 1999; 160: pp. 648-654.
21. Hoffman E.A., Clough A.V., Christensen G.E., et. al.: The comprehensive imaging-based analysis of the lung: a forum for team science. Acad Radiol 2004; 11: pp. 1370-1380.
22. Simon B.A., Marcucci C., Fung M., et. al.: Parameter estimation and confidence intervals for Xe-CT ventilation studies: a Monte Carlo approach. J Appl Physiol 1998; 84: pp. 709-716.
23. Hubmayr R.D., Rodarte J.R., Walters B.J., et. al.: Regional ventilation during spontaneous breathing and mechanical ventilation in dogs. J Appl Physiol 1987; 63: pp. 2467-2475.
24. Robertson H.T., Glenny R.W., Stanford D., et. al.: High-resolution maps of regional ventilation utilizing inhaled fluorescent microspheres. J Appl Physiol 1997; 82: pp. 943-953.
25. Yamada Y., Burnham C., Hales C.A., et. al.: Regional mapping of gas transport during high-frequency and conventional ventilation. J Appl Physiol 1989; 66: pp. 1209-1218.
26. Allen J.L., Frantz I.D., Fredberg J.J.: Regional alveolar pressure during periodic flow. Dual manifestations of gas inertia. J Clin Invest 1985; 76: pp. 620-629.
27. Allen J.L., Frantz I.D., Fredberg J.J.: Heterogeneity of mean alveolar pressure during high-frequency oscillations. J Appl Physiol 1987; 1987: pp. 223-228.