
Rationale and Objectives
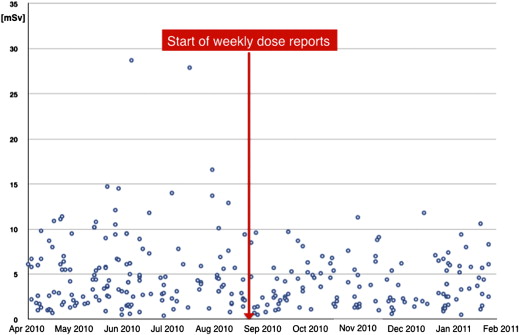
Numerous protocols have been developed to reduce cardiac computed tomography angiography (cCTA) radiation dose while maintaining image quality. However, cCTA practice is highly dependent on physician and technologist experience and education. In this study, we sought to evaluate the incremental value of real-time feedback via weekly dose reports on a busy cCTA service.
Materials and Methods
This time series analysis consisted of 450 consecutive patients whom underwent physician-supervised cCTA for clinically indicated native coronary evaluation between April 2011 and January 2013, with 150 patients before the initiation of weekly dose report (preintervention period: April–September 2011) and 150 patients after the initiation (postintervention period: September 2011–February 2012). To assess whether overall dose reductions were maintained over time, results were compared to a late control group consisting of 150 consecutive cCTA exams, which were performed after the study (September 2012–January 2013). Patient characteristics and effective radiation were recorded and compared.
Results
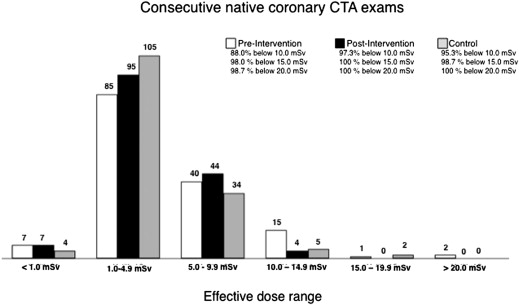
Total radiation dose was significantly lower in the postintervention period (3.4 mSv [1.7–5.7] and in the late control group (3.3 mSv [2.0–5.3] versus the preintervention period (4.1 mSv [2.1–6.6] ( P = .005). The proportion of high-dose outliers was also decreased in the postintervention period and late control period (exams <10 mSv were 88.0% preintervention vs. 97.3% postintervention vs. 95.3% late control; exams <15 mSv were 98.0% preintervention vs. 100.0% postintervention vs. 98.7% late control; exams <20.0 mSv were 98.7% preintervention vs. 100.0% postintervention vs. 100.0% late control).
Conclusion
Weekly dose report feedback of site radiation doses to patients undergoing physician-supervised cCTA resulted in significant overall dose reduction and reduction of high-dose outliers. Overall dose reductions were maintained beyond the initial study period.
Coronary computed tomography angiography (cCTA) has emerged as a reliable tool to exclude significant coronary artery disease in low- to intermediate-risk patients . Numerous technological advances have addressed radiation exposure , which previously was an important drawback of this new imaging modality . In selected patients, some scanners allow the reduction of the effective dose to <1 mSv . In nonobese patients, the use of decreased tube potential settings (available on all scanners) allows for significantly decreased radiation doses with preserved image quality .
The dose reduction potential of protocols tailored for specific parameters, chiefly heart rate and body mass index, has been demonstrated . Yet in the clinical setting, compliance with such protocols can be a challenge, because cCTA is a highly operator-dependent modality and is dramatically influenced by physicians’ and technologists’ experience and education . An important first step in the process of dose reduction (and any quality assurance method) is the accurate measurement, tracking, and communication of radiation doses .
Get Radiology Tree app to read full this article<
Get Radiology Tree app to read full this article<
Methods
Financial Disclosure
Get Radiology Tree app to read full this article<
Study Cohort
Get Radiology Tree app to read full this article<
Study Design and Intervention
Get Radiology Tree app to read full this article<
Postintervention Period
Get Radiology Tree app to read full this article<
Get Radiology Tree app to read full this article<
Get Radiology Tree app to read full this article<
Get Radiology Tree app to read full this article<
Preintervention Period
Get Radiology Tree app to read full this article<
Control Group
Get Radiology Tree app to read full this article<
Get Radiology Tree app to read full this article<
Scan Protocol
Get Radiology Tree app to read full this article<
Get Radiology Tree app to read full this article<
Get Radiology Tree app to read full this article<
Estimation of Radiation Dose and Data Collection
Get Radiology Tree app to read full this article<
Get Radiology Tree app to read full this article<
Statistical Analysis
Get Radiology Tree app to read full this article<
Results
Get Radiology Tree app to read full this article<
Table 1
Baseline Characteristics
Characteristics Preintervention ( n = 150) Postintervention ( n = 150) Late Control ( n = 150)P Value Age (y) 56.5 ± 13.7 54.5 ± 14.3 54.4 ± 15.8 .375 Male gender (%) 85 (56.7%) 80 (53.3%) 72 (48.0%) .320 Height (in.) 66.8 ± 4.4 66.7 ± 4.4 65.9 ± 8.6 .379 Weight (lb.) 183.1 ± 47.1 183.9 ± 48.0 188.6 ± 47.1 .555 BMI (kg/m 2 ) 28.8 ± 6.5 28.4 ± 5.9 29.8 ± 6.6 .145 Beta blockade (%) 110 (73.3%) 114 (76%) 127 (84.7%) .046 Heart rate (beats/min) 59.4 ± 9.3 61.1 ± 11.2 63.7 ± 17.8 .019 Sinus rhythm (%) 140 (93%) 139 (93%) 142 (94.7%) .770
Get Radiology Tree app to read full this article<
Get Radiology Tree app to read full this article<
Get Radiology Tree app to read full this article<
Get Radiology Tree app to read full this article<
Get Radiology Tree app to read full this article<
Table 2
Scan Parameters
Characteristics Preintervention ( n = 150) Postintervention ( n = 150) Late Control ( n = 150)P Value 80 kVp 24 (16.0%) 29 (19.3%) 36 (24.0%) 100 kVp 57 (38.0%) 51 (34.0%) 61 (40.6%) <.001 120 kVp 62 (41.3%) 47 (31.3%) 46 (30.7%) 140 kVp 7 (4.7%) 23 (15.3%) 7 (4.7%) mAs [IQR] 245.0 [167.5–315.5] 281.0 [230.3–281.5] 245.5 [182.0–305.0] <.001 Use of AEC (%) 147 (98%) 148 (98.7%) 147 (98%) .880 ECG synchronization mode High-pitch helical prospective triggered (%) 29 (19.3%) 41 (27.3%) 18 (12.0%) .004 Axial-sequential prospective triggering (%) 61 (40.7%) 98 (65.3%) 116 (77.3%) <.001 Retrospective gating (%) 60 (40.0%) 11 (7.3%) 16 (10.7%) <.001 Scan length (cm) 16.7 ± 4.2 17.9 ± 7.5 14.0 ± 2.9 <.001 Contrast agent (mL) 97.8 ± 24.0 88.9 ± 19.1 104.2 ± 38.6 <.001 Flow rate (cc/sec) 5.9 ± 0.6 6.0 ± 1.3 5.7 ± 2.6 .305
AEC, automated exposure control; ECG, electrocardiogram; IQR, interquartile range.
Get Radiology Tree app to read full this article<
Get Radiology Tree app to read full this article<
Discussion
Get Radiology Tree app to read full this article<
Get Radiology Tree app to read full this article<
Get Radiology Tree app to read full this article<
Get Radiology Tree app to read full this article<
Get Radiology Tree app to read full this article<
Get Radiology Tree app to read full this article<
Table 3
Heart Rates and Body Mass Index for Each Scan Technique
Preintervention Postintervention Late Control High-pitch helical prospective triggered • Heart rate (beats/min) 59.0 ± 8.8 60.6 ± 11.3 62.5 ± 17.7 • BMI (kg/m 2 ) 28.8 ± 6.5 27.6 ± 5.3 28.4 ± 4.6 Axial-sequential prospective triggering • Heart rate (beats/min) 59.4 ± 9.3 61.1 ± 11.4 63.1 ± 17.3 • Body mass index (kg/m 2 ) 28.5 ± 6.5 28.6 ± 5.8 29.5 ± 6.2 Retrospective gating • Heart rate (beats/min) 59.0 ± 8.9 61.8 ± 13.1 65.0 ± 17.4 • Body mass index (kg/m 2 ) 28.7 ± 6.6 30.2 ± 5.8 30.8 ± 6.6
Get Radiology Tree app to read full this article<
Get Radiology Tree app to read full this article<
Table 4
Dose Parameters
Parameters Pre-intervention ( n = 150) Post-intervention ( n = 150) Late Control ( n = 150)P Value CTDI vol 26.2 [16.1–38.9] 21.8 [16.0–32.8] 21.1 [15.2–39.0] .007 DLP (mGy × cm) [IQR] 291.0 [152.5–470.3] 245.0 [123.3–409.5] 238.0 [146.0–372.0] .004 ED (mSv) [IQR] 4.1 [2.1–6.6] 3.4 [1.7–5.7] 3.3 [2.0–5.3] .005
CTDI vol , volume-weighted computed tomography dose index; DLP, dose-length-product; ED, effective dose; IQR, interquartile range.
Get Radiology Tree app to read full this article<
Get Radiology Tree app to read full this article<
Get Radiology Tree app to read full this article<
Appendix
Get Radiology Tree app to read full this article<
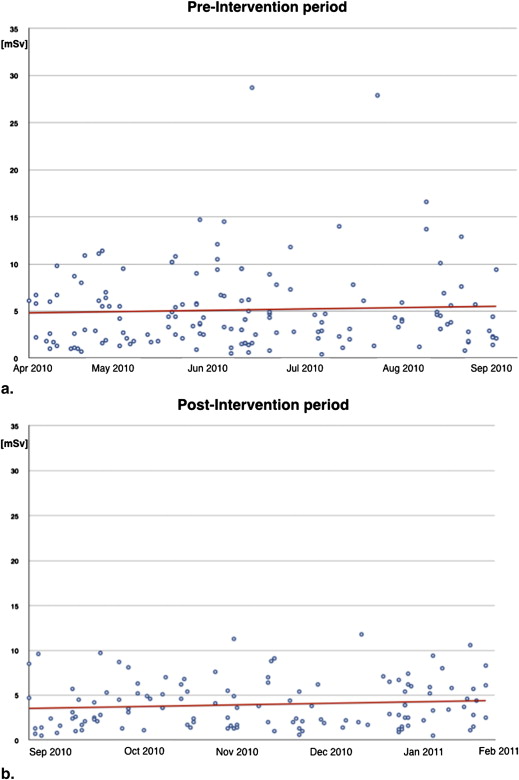
Table 1
Patient Characteristics and Scan Parameters in Coronary CTA Scans >10 mSv
All Outliers ≥10 mSv 10.0–14.9 mSv 15.0–19.9 mSv 20.0–24.9 mSv >25.0 mSv Preintervention group Total number 18 15 1 2Patient characteristics BMI (kg/m 2 ) 33.0 ± 8.9 31.2 ± 7.3 27.4 43.0 ± 12.7 HR (beats/min) 58.6 ± 9.5 59.1 ± 7.6 43.0 62.5 ± 20.5 SR 14/18 12/15 1/1 1/2 BB 10/18 9/15 1/1 0/2Scan parameters 80 kVp 0 0 0 0 100 kVp 4 4 0 0 120 kVp 14 11 1 2 140 kVp 0 0 0 0 Axial-sequential prospective triggering 2/18 2/18 0 0 Retrospective gating 16/18 13/18 1/1 2/2 Scan length (cm) 16.3 ± 2.8 16.3 ± 3.0 15.5 16.5 ± 1.6 Postintervention group Total number 4 4 — — —Patient characteristics BMI (kg/m 2 ) 37.7 ± 2.8 37.7 ± 2.8 HR (beats/min) 71.5 ± 13.1 71.5 ± 13.1 SR 4/4 4/4 BB 3/4 3/4Scan Parameters 80 kVp 0 0 100 kVp 0 0 120 kVp 3 3 140 kVp 1 1 Axial-sequential prospective triggering 4 4 Retrospective gating 0 0 Scan length (cm) 14.9 ± 2.0 14.9 ± 2.0 Late control group Total number 7 5 2Patient characteristic BMI (kg/m 2 ) 40.2 ± 11.1 38.9 ± 12.4 43.6 ± 9.3 HR (beats/min) 81.7 ± 17.4 76.8 ± 6.8 94.0 ± 33.9 SR 7/7 5/5 2/2 BB 6/7 4/5 2/2Scan parameters 80 kVp 0 0 0 100 kVp 0 0 0 120 kVp 6 4 2 140 kVp 1 1 0 Axial-sequential prospective triggering 3/7 2/5 1/2 Retrospective gating 4/7 3/5 1/2 Scan length (cm) 15.6 ± 2.0 16.0 ± 2.1 14.8 ± 1.9
BMI, body mass index; CTA, computed tomography angiography; HR, heart rate; SR, sinus rhythm; BB, beta blockade.
Get Radiology Tree app to read full this article<
Get Radiology Tree app to read full this article<
References
1. Hoffmann U., Bamberg F., Chae C.U., et. al.: Coronary computed tomography angiography for early triage of patients with acute chest pain: the ROMICAT (Rule Out Myocardial Infarction using Computer Assisted Tomography) trial. J Am Coll Cardiol 2009; 53: pp. 1642-1650.
2. Hoffmann U., Nagurney J.T., Moselewski F., et. al.: Coronary multidetector computed tomography in the assessment of patients with acute chest pain. Circulation 2006; 114: pp. 2251-2260.
3. Achenbach S., Goroll T., Seltmann M., et. al.: Detection of coronary artery stenoses by low-dose, prospectively ECG-triggered, high-pitch spiral coronary CT angiography. JACC Cardiovasc Imaging 2011; 4: pp. 328-337.
4. Bittencourt M.S., Schmidt B., Seltmann M., et. al.: Iterative reconstruction in image space (IRIS) in cardiac computed tomography: initial experience. Int J Cardiovasc Imaging 2010; 27: pp. 1081-1087.
5. Deetjen A., Mollmann S., Conradi G., et. al.: Use of automatic exposure control in multislice computed tomography of the coronaries: comparison of 16-slice and 64-slice scanner data with conventional coronary angiography. Heart 2007; 93: pp. 1040-1043.
6. Hausleiter J., Martinoff S., Hadamitzky M., et. al.: Image quality and radiation exposure with a low tube voltage protocol for coronary CT angiography results of the PROTECTION II Trial. JACC Cardiovasc Imaging 2010; 3: pp. 1113-1123.
7. Lee A.M., Engel L.C., Shah B., et. al.: Coronary computed tomography angiography during arrhythmia: Radiation dose reduction with prospectively ECG-triggered axial and retrospectively ECG-gated helical 128-slice dual-source CT. J Cardiovasc Comput Tomogr 2012; 6: pp. 172-183.
8. Stolzmann P., Leschka S., Scheffel H., et. al.: Dual-source CT in step-and-shoot mode: noninvasive coronary angiography with low radiation dose. Radiology 2008; 249: pp. 71-80.
9. Winklehner A., Goetti R., Baumueller S., et. al.: Automated attenuation-based tube potential selection for thoracoabdominal computed tomography angiography: improved dose effectiveness. Invest Radiol 2011; 46: pp. 767-773.
10. Brenner D.J., Hall E.J.: Computed tomography—an increasing source of radiation exposure. N Engl J Med 2007; 357: pp. 2277-2284.
11. Raff G.L.: Radiation dose from coronary CT angiography: five years of progress. J Cardiovasc Comput Tomogr 2010; 4: pp. 365-374.
12. Achenbach S., Marwan M., Ropers D., et. al.: Coronary computed tomography angiography with a consistent dose below 1 mSv using prospectively electrocardiogram-triggered high-pitch spiral acquisition. Eur Heart J 2010; 31: pp. 340-346.
13. Heilbron B.G., Leipsic J.: Submillisievert coronary computed tomography angiography using adaptive statistical iterative reconstruction - a new reality. Can J Cardiol 2010; 26: pp. 35-36.
14. Labounty T.M., Leipsic J., Poulter R., et. al.: Coronary CT angiography of patients with a normal body mass index using 80 kVp versus 100 kVp: a prospective, multicenter, multivendor randomized trial. AJR Am J Roentgenol 2011; 197: pp. W860-W867.
15. Alkadhi H., Stolzmann P., Scheffel H., et. al.: Radiation dose of cardiac dual-source CT: the effect of tailoring the protocol to patient-specific parameters. Eur J Radiol 2008; 68: pp. 385-391.
16. LaBounty T.M., Earls J.P., Leipsic J., et. al.: Effect of a standardized quality-improvement protocol on radiation dose in coronary computed tomographic angiography. Am J Cardiol 2010; 106: pp. 1663-1667.
17. LaBounty T.M., Leipsic J., Mancini G.B., et. al.: Effect of a standardized radiation dose reduction protocol on diagnostic accuracy of coronary computed tomographic angiography. Am J Cardiol 2010; 106: pp. 287-292.
18. Abbara S., Arbab-Zadeh A., Callister T.Q., et. al.: SCCT guidelines for performance of coronary computed tomographic angiography: a report of the Society of Cardiovascular Computed Tomography Guidelines Committee. J Cardiovasc Comput Tomogr 2009; 3: pp. 190-204.
19. Fazel R., Krumholz H.M., Wang Y., et. al.: Exposure to low-dose ionizing radiation from medical imaging procedures. N Engl J Med 2009; 361: pp. 849-857.
20. Ghoshhajra B.B., Engel L.C., Major G.P., et. al.: Evolution of coronary computed tomography radiation dose reduction at a tertiary referral center. Am J Med 2012; 125: pp. 764-772.
21. Ghoshhajra B.B., Engel L.C., Karolyi M., et. al.: Cardiac computed tomography angiography with automatic tube potential selection: effects on radiation dose and image quality. J Thorac Imaging 2013; 28: pp. 40-48.
22. Park Y.J., Kim Y.J., Lee J.W., et. al.: Automatic tube potential selection with tube current modulation (APSCM) in coronary CT angiography: comparison of image quality and radiation dose with conventional body mass index-based protocol. J Cardiovasc Comput Tomogr 2012; 6: pp. 184-190.
23. McCollough C., Edyvean S., Geise R., et. al., Rothenberg LAAPM Task Group 23 , Diagnostic Imaging Council CT Committee : The measurement, reporting, and management of radiation dose in CT. AAPM Report No 96.2008.American Association of Physicists in MedicineCollege Park, MD
24. Einstein A.J.: Radiation risk from coronary artery disease imaging: how do different diagnostic tests compare?. Heart 2008; 94: pp. 1519-1521.
25. Herzog B.A., Wyss C.A., Husmann L., et. al.: First head-to-head comparison of effective radiation dose from low-dose 64-slice CT with prospective ECG-triggering versus invasive coronary angiography. Heart 2009; 95: pp. 1656-1661.
26. Blankstein R., Bolen M.A., Pale R., et. al.: Use of 100 kV versus 120 kV in cardiac dual source computed tomography: effect on radiation dose and image quality. Int J Cardiovasc Imaging 2011; 27: pp. 579-586.
27. Feuchtner G.M., Jodocy D., Klauser A., et. al.: Radiation dose reduction by using 100-kV tube voltage in cardiac 64-slice computed tomography: a comparative study. Eur J Radiol 2010; 75: pp. e51-e56.
28. Hou Y., Yue Y., Guo W., et. al.: Prospectively versus retrospectively ECG-gated 256-slice coronary CT angiography: image quality and radiation dose over expanded heart rates. Int J Cardiovasc Imaging 2012; 28: pp. 153-162.
29. Scheffel H., Alkadhi H., Leschka S., et. al.: Low-dose CT coronary angiography in the step-and-shoot mode: diagnostic performance. Heart 2008; 94: pp. 1132-1137.
30. Ghoshhajra B.B., Engel L.C., Major G.P., et. al.: Direct chest area measurement: A potential anthropometric replacement for BMI to inform cardiac CT dose parameters?. J Cardiovasc Comp Tomogr 2011; 5: pp. 240-246.
31. Kropil P., Rojas C.A., Ghoshhajra B., et. al.: Prospectively ECG-triggered high-pitch spiral acquisition for cardiac CT angiography in routine clinical practice: initial results. J Thorac Imaging 2012; 27: pp. 194-201.
32. Techasith T., Ghoshhajra B.B., Truong Q.A., et. al.: The effect of heart rhythm on patient radiation dose with dual-source cardiac computed tomography. J Cardiovasc Comp Tomogr 2011; 5: pp. 255-263.
33. Leonard K., Masatu M.C.: Outpatient process quality evaluation and the Hawthorne effect. Soc Sci Med 2006; 63: pp. 2330-2340.