
Rationale and Objectives
The Association of Program Directors in Radiology (APDR) surveys residents’ educational experiences, work responsibilities, and benefits to support radiology residency programs and their directors.
Materials and Methods
This is an observational cross-sectional study using three Web-based surveys posed to the APDR membership in the spring of 2013 (March 7–29, 2013; 44 items), the fall of 2013 (October 24 to November 15, 2013; 36 items), and the spring of 2014 (March 3–21, 2014; 49 items) on the American Board of Radiology (ABR) Core examination, organization of Clinical Competency Committees (CCCs), fellowship match, and interventional radiology (IR)–diagnostic radiology (DR) training programs.
Results
Responses were collected electronically, results were tallied using SurveyMonkey software, and qualitative responses were tabulated or summarized as comments. Findings were reported during the 60th and 61st annual meetings of the Association of University Radiologists, respectively. The maximal response rate was 35% in the spring 2013, 39% in the fall 2013, and 39% in the spring 2014.
Conclusions
With the ABR Core examination, radiology educators increasingly included multiple choice questions in teaching conferences. “Boards frenzy” was alive and well. The number of programs with a CCC was growing, chaired primarily by the Program Director (PD), with the most commonly used tool being the rotation evaluation. In view of “fellowship frenzy” in the third year of residency, only a minority of PDs were against a fellowship match in the National Resident Matching Program (NRMP). The majority of respondents replied that the new IR/DR pathway would negatively affect the DR residency.
Since 2000, the Association of Program Directors in Radiology (APDR) has conducted an annual survey of its membership on issues affecting training in accredited residency programs in the United States and Canada. The APDR uses the data generated by the survey to promote improvements in resident education through exchange of ideas, to provide benchmarks guiding local resource allocation, to support the Radiology Residency Program Director (PD) community, and to facilitate communications with the Accreditation Council for Graduate Medical Education (ACGME) and the American Board of Radiology (ABR). To make information more generally accessible, the results of the annual APDR Survey were first published in 2012. In this follow-up article, we analyze the results of the 2013 and 2014 surveys and discuss recent trends in resident education from the PD’s perspective.
Materials and methods
We performed an observational cross-sectional study using three Web-based surveys conducted between March 2013 and March 2014. Members of the 2012–2013 APDR Annual Survey Committee selected questions from those proposed by the committee members and the APDR leadership for inclusion in the surveys. The Committee Chair, with the help from other medical educators, selected and edited the highest quality questions. Before distribution, the questions were reviewed and approved by the current APDR president. The 2013 spring survey (March 7–29, 2013) had 44 items, the 2013 fall survey (October 24 to November 15, 2013) had 36 items, and the 2014 spring survey (March 3–21, 2014) had 49 items.
Get Radiology Tree app to read full this article<
Results
Demographics
Get Radiology Tree app to read full this article<
Table 1
Respondents’ Demographics
Spring 2013 ∗ Fall 2013 Spring 2014 Participation Participants 114 132 122 Total membership 326 340 314 Response rate (%) 35 39 39 Affiliation (% respondents) University 69 68 University affiliated 22 24 Community 17 17 Military 4 1 Appointment (% respondents) Full time 80 82 Tenured 8 3 On tenure track 1 4 Nontenured 21 22 Clinician investigator 2 3 Clinician educator 29 35 Research scientist 0 0 Academic rank (% respondents) Professor 32 28 Associate professor 32 28 Assistant professor 38 44 Program size (% respondents) ≤12 13 16 13–28 42 44 29–40 29 28 >40 16 12 Location (% respondents) Northeast 35 37 Southeast 14 22 Central/Midwest 31 24 Western 20 17
Get Radiology Tree app to read full this article<
Get Radiology Tree app to read full this article<
The 2014 American Board of Radiology Core Examination (Spring 2013 to Spring 2014)
Get Radiology Tree app to read full this article<
Get Radiology Tree app to read full this article<
Get Radiology Tree app to read full this article<
Get Radiology Tree app to read full this article<
Get Radiology Tree app to read full this article<
ACGME Competencies : Milestone Achievement (Fall 2013)
Get Radiology Tree app to read full this article<
Table 2
Milestone Assessment Tools
Assessment Tool % High penetration (>75% respondents use these) 360° evaluations 94 Direct observation and feedback 89 End-of-rotation faculty evaluations 95 Case/procedure logs 89 Self-assessment and reflections/portfolio 76 Moderate penetration (40%–70% respondents use these) Procedural competency checklists 46 ER preparedness tests 57 Formal review of dictated reports 47 Tracking rate of major discrepancies 47 Timeline on completing institutional and program requirements 48 QI project presentation with feedback 66 Completion of institutional safety modules 67 Completion of professionalism and/or communication modules 42 Low penetration (<40% respondents use these) Simulation/OSCE 20 Critical incidents reporting and feedback 31 Completion of knowledge-based modules on health care economics 23 End-of-rotation examinations 28
ER, emergency room; OSCE, objective structured clinical examination; QI, quality improvement.
Get Radiology Tree app to read full this article<
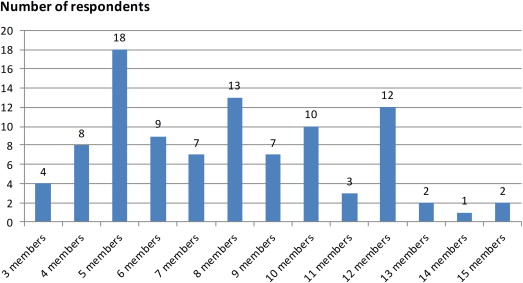
Clinical Competency Committee: Size and Composition (Spring 2013 to Spring 2014)
Get Radiology Tree app to read full this article<
Get Radiology Tree app to read full this article<
Get Radiology Tree app to read full this article<
Get Radiology Tree app to read full this article<
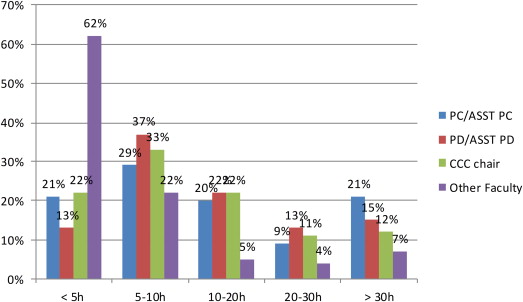
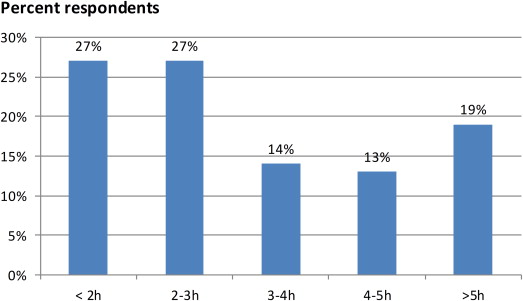
Clinical Competency Committee: Workload and Tools
Get Radiology Tree app to read full this article<
Get Radiology Tree app to read full this article<
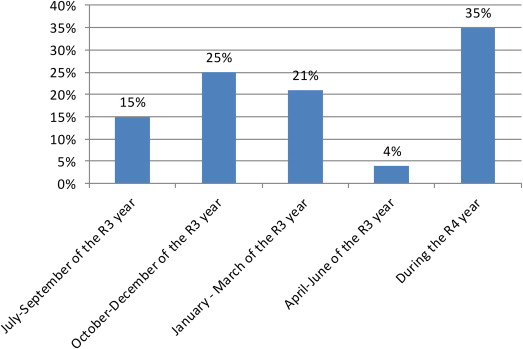
Fellowship Match
Get Radiology Tree app to read full this article<
Get Radiology Tree app to read full this article<
Get Radiology Tree app to read full this article<
Get Radiology Tree app to read full this article<
IR–DR Program
Get Radiology Tree app to read full this article<
New Accreditation System: Core Faculty
Get Radiology Tree app to read full this article<
Discussion
Get Radiology Tree app to read full this article<
Get Radiology Tree app to read full this article<
Get Radiology Tree app to read full this article<
Get Radiology Tree app to read full this article<
Get Radiology Tree app to read full this article<
Get Radiology Tree app to read full this article<
Get Radiology Tree app to read full this article<
Get Radiology Tree app to read full this article<
Get Radiology Tree app to read full this article<
Get Radiology Tree app to read full this article<
Get Radiology Tree app to read full this article<
Conclusions
Get Radiology Tree app to read full this article<
Get Radiology Tree app to read full this article<
Acknowledgments
Get Radiology Tree app to read full this article<
References
1. What program directors think: results of the 2011 annual survey of the Association of Program Directors in Radiology. Acad Radiol 2012; 9: pp. 1582-1588.
2. http://www.apdr.org/ .
3. https://www.rsna.org/RSNA/AAPM_Online_Physics_Modules_.aspx .
4. http://www.theabr.org/ic-ro-score .
5. Swing S.R.: The ACGME outcomes project: retrospective and perspective. Med Teach 2007 Sep; 29: pp. 648-654.
6. http://www.acgme.org/acgmeweb/tabid/430/ProgramandInstitutionalAccreditation/NextAccreditationSystem/Milestones.aspx .
7. Baruch Y., Holtom B.: Survey response rate levels and trends in organizational research. Hum Relat 2008; 61: pp. 1139-1160.
8. Porter R.S., Whitcomb M.E., Weitzer W.H.: Multiple surveys of students and survey fatigue. New Directions for Institutional Research 2004; 121: pp. 63-73.
9. Mamdani M., Sykora K., Li P., et. al.: Reader’s guide to critical appraisal of cohort studies: 2. Assessing potential for confounding. BMJ 2005; 330: pp. 960-962.
10. Berk A.: An introduction to sample selection bias in sociological data. Am Sociol Rev 1983; 48: pp. 386-398.
11. Tversky A., Kahneman D.: The framing of decisions and the psychology of choice. Science 1981; 211: pp. 453-458.
12. Sackett D.L.: Bias in analytic research. J Chron Dis 1979; 32: pp. 51-63.
13. Kreuter F., Presser S., Tourangeau R.: Social desirability bias in CATI, IVR, and Web surveys: the effects of mode and question sensitivity. Public Opin Q 2008; 72: pp. 847-865.
14. http://www.theabr.org/ic-ro-score .
15. Goodman C.J., Lindsey J.I., Whigham C.J., et. al.: Diagnostic radiology residents in the classes of 1999 and 2000: fellowship and employment. AJR 2000; 174: pp. 1211-1213.
16. Roth A.E.: New physicians: a natural experiment in market organization. Science 1990; 250: pp. 1524-1528.