
Rationale and Objectives
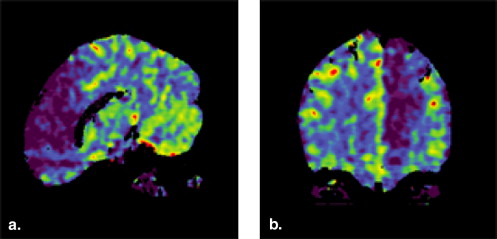
This study determines the value of whole brain color-coded three-dimensional perfused blood volume (PBV) computed tomography (CT) for the visualization of the infarcted tissue in acute stroke patients.
Materials and Methods
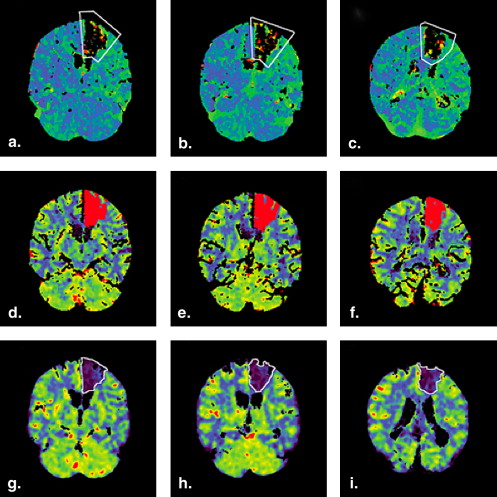
Nonenhanced CT (NECT), perfusion CT (PCT), and CT angiography (CTA) in 48 patients with acute ischemic stroke were performed. Whole brain PBV was calculated from NECT and CTA data sets using commercial software. PBV slices in identical orientation to the PCT slices were reconstructed and the area of visual perfusion abnormality on PBV maps was measured. The infarct core in the corresponding PCT slices (CBV <2.0 mL/100 g) was measured automatically with commercial software. The ischemic area on PBV and the infarct core on quantitative PCT were compared using the Pearsons-R correlation coefficient. Significance was considered for P < .05.
Results
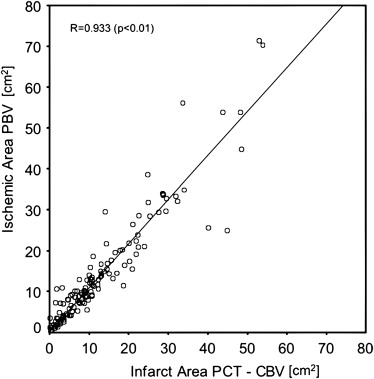
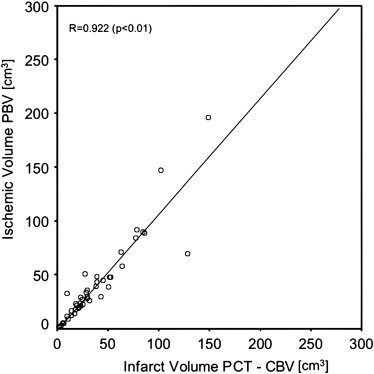
The quantitative PCT demonstrated a mean infarct core volume of 35.48 ± 32.17 cm 3 , whereas the volume of visual perfusion abnormality of the corresponding PBV slices was 37.16 ± 37.59 cm 3 . The perfusion abnormality in PBV was highly correlated with the infarct core of quantitative PCT for area per slice ( r = 0.933, P < .01) as well as volume ( r = 0.922, P < .01).
Conclusions
PBV can serve as surrogate marker corresponding to the infarct core in acute stroke with whole brain coverage.
Stroke is one of the major diseases resulting in death or permanent disability worldwide . In Western countries, the age adjusted incidence rate is about 180 per 100,000 per year . Most strokes are caused by acute cerebral ischemia from occlusion of a cerebral artery. Rapid diagnosis with exclusion of cerebral hemorrhage and identification of the extent of infarction is mandatory in today’s acute stroke management . Both computed tomography (CT) and magnetic resonance imaging, have been proven to meet these demands . Automated analysis software has proven to enhance detection and volumetric assessment of ischemic stroke in an animal magnetic resonance imaging model . However, CT is the most frequently used method in clinical routine because of its wide availability . The combination of nonenhanced CT (NECT) with perfusion CT (PCT) increases the detection rate of ischemia and allows a better estimation of the extent of infarction . From PCT data, several perfusion parameters as well as brain barrier permeability can be calculated. It has been shown that absolute cerebral blood volume thresholds (CBV) can differentiate infarcted from noninfarcted tissue . However, PCT has limited volume coverage of typically 2–4 cm . CT angiography (CTA), on the other hand, covers the entire brain using current CT scanner technology and is typically included in a state-of-the-art CT stroke protocol for vessel assessment . Besides the visualization of cerebral vasculature, hemodynamic information is included in CTA data as well . Commercial software can calculate perfused blood volume (PBV) maps by the subtraction of the NECT from the CTA data . In theory, the information in terms of infarcted tissue should be similar between PBV maps and CBV maps generated from PCT data.
The aim of this study was to assess whole brain color-coded three-dimensional PBV CT for the visualization of infarcted tissue in acute stroke patients. Therefore, the visual perfusion abnormality in PBV maps was compared with the infarct core determined by absolute CBV thresholds on dynamic PCT.
Materials and methods
Patients
Get Radiology Tree app to read full this article<
Get Radiology Tree app to read full this article<
Imaging Protocol
Get Radiology Tree app to read full this article<
Get Radiology Tree app to read full this article<
Postprocessing
Get Radiology Tree app to read full this article<
Get Radiology Tree app to read full this article<
Image Analysis
Get Radiology Tree app to read full this article<
Get Radiology Tree app to read full this article<
Get Radiology Tree app to read full this article<
Statistics
Get Radiology Tree app to read full this article<
Results
Get Radiology Tree app to read full this article<
Table 1
Study Population
Women_n_ = 30 Men_n_ = 18 Mean age 74.7 ± 12.2 y Mean NIHSS score 11.40 ± 4.93 Time interval between OOS and imaging 3.3 ± 2.9 hours
NIHSS, National Institute of Health Stroke Scale; OOS, onset of symptoms.
Get Radiology Tree app to read full this article<
Get Radiology Tree app to read full this article<
Get Radiology Tree app to read full this article<
Discussion
Get Radiology Tree app to read full this article<
Get Radiology Tree app to read full this article<
Get Radiology Tree app to read full this article<
Get Radiology Tree app to read full this article<
Get Radiology Tree app to read full this article<
Get Radiology Tree app to read full this article<
References
1. Lopez A.D., Mathers C.D., Ezzati M., et. al.: Global and regional burden of disease and risk factors, 2001: systematic analysis of population health data. Lancet 2006; 367: pp. 1747-1757.
2. Rosamond W., Flegal K., Furie K., et. al.: Heart disease and stroke statistics—2008 update: a report from the American Heart Association Statistics Committee and Stroke Statistics Subcommittee. Circulation 2008; 117: pp. e25-e146.
3. Adams H.P., del Zoppo G., Alberts M.J., et. al.: Guidelines for the early management of adults with ischemic stroke: a guideline from the American Heart Association/American Stroke Association Stroke Council, Clinical Cardiology Council, Cardiovascular Radiology and Intervention Council, and the Atherosclerotic Peripheral Vascular Disease and Quality of Care Outcomes in Research Interdisciplinary Working Groups: The American Academy of Neurology affirms the value of this guideline as an educational tool for neurologists. Circulation 2007; 115: pp. e478-e534.
4. Lovblad K.O., Baird A.E.: Actual diagnostic approach to the acute stroke patient. Eur Radiol 2006; 16: pp. 1253-1269.
5. Liu S.X., Imielinska C., Laine A., et. al.: Asymmetry analysis in rodent cerebral ischemia models. Acad Radiol 2008; 15: pp. 1181-1197.
6. Barber P.A., Hill M.D., Eliasziw M., et. al.: Imaging of the brain in acute ischaemic stroke: comparison of computed tomography and magnetic resonance diffusion-weighted imaging. J Neurol Neurosurg Psychiatry 2005; 76: pp. 1528-1533.
7. Montiel N.H., Rosso C., Chupin N., et. al.: Automatic prediction of infarct growth in acute ischemic stroke from MR apparent diffusion coefficient maps. Acad Radiol 2008; 15: pp. 77-83.
8. Parsons M.W., Pepper E.M., Bateman G.A., et. al.: Identification of the penumbra and infarct core on hyperacute noncontrast and perfusion CT. Neurology 2007; 68: pp. 730-736.
9. Wang X.C., Gao P.Y., Xue J., et. al.: Computed tomography perfusion source images assessment of infarct core and penumbra in acute stroke. Neurol Res 2009; 31: pp. 351-354.
10. Doss A.X.: Clinical application of multidetector CT angiography and perfusion imaging in acute stroke. J Med Imaging Radiat Oncol 2009; 53: pp. 283-290.
11. Bisdas S., Konstantinou G., Surlan-Popovic K., et. al.: Dynamic contrast-enhanced CT of head and neck tumors: comparison of first-pass and permeability perfusion measurements using two different commercially available tracer kinetics models. Acad Radiol 2008; 15: pp. 1580-1589.
12. MacLeod A.G., Dickinson P.J., LeCouteur R.A., et. al.: Quantitative assessment of blood volume and permeability in cerebral mass lesions using dynamic contrast-enhanced computed tomography in the dog. Acad Radiol 2009; 16: pp. 1187-1195.
13. Wintermark M., Flanders A.E., Velthuis B., et. al.: Perfusion-CT assessment of infarct core and penumbra: receiver operating characteristic curve analysis in 130 patients suspected of acute hemispheric stroke. Stroke 2006; 37: pp. 979-985.
14. Wintermark M., Sesay M., Barbier E., et. al.: Comparative overview of brain perfusion imaging techniques. J Neuroradiol 2005; 32: pp. 294-314.
15. Verro P., Tanenbaum L.N., Borden N., et. al.: Clinical application of CT angiography in acute ischemic stroke. Clin Neurol Neurosurg 2007; 109: pp. 138-145.
16. Hunter G.J., Hamberg L.M., Ponzo J.A., et. al.: Assessment of cerebral perfusion and arterial anatomy in hyperacute stroke with three-dimensional functional CT: early clinical results. AJNR Am J Neuroradiol 1998; 19: pp. 29-37.
17. Kloska S.P., Fischer T., Nabavi D.G., et. al.: Color-coded perfused blood volume imaging using multidetector CT: initial results of whole-brain perfusion analysis in acute cerebral ischemia. Eur Radiol 2007; 17: pp. 2352-2358.
18. Klotz E., Konig M.: Perfusion measurements of the brain: using dynamic CT for the quantitative assessment of cerebral ischemia in acute stroke. Eur J Radiol 1999; 30: pp. 170-184.
19. Hamberg L.M., Hunter G.J., Kierstead D., et. al.: Measurement of cerebral blood volume with subtraction three-dimensional functional CT. AJNR Am J Neuroradiol 1996; 17: pp. 1861-1869.
20. Murphy B.D., Fox A.J., Lee D.H., et. al.: White matter thresholds for ischemic penumbra and infarct core in patients with acute stroke: CT perfusion study. Radiology 2008; 247: pp. 818-825.
21. Muir K.W., Halbert H.M., Baird T.A., et. al.: Visual evaluation of perfusion computed tomography in acute stroke accurately estimates infarct volume and tissue viability. J Neurol Neurosurg Psychiatry 2006; 77: pp. 334-339.
22. Schaefer P.W., Roccatagliata L., Ledezma C., et. al.: First-pass quantitative CT perfusion identifies thresholds for salvageable penumbra in acute stroke patients treated with intra-arterial therapy. AJNR Am J Neuroradiol 2006; 27: pp. 20-25.
23. Lev M.H., Segal A.Z., Farkas J., et. al.: Utility of perfusion-weighted CT imaging in acute middle cerebral artery stroke treated with intra-arterial thrombolysis: prediction of final infarct volume and clinical outcome. Stroke 2001; 32: pp. 2021-2028.
24. Hunter G.J., Silvennoinen H.M., Hamberg L.M., et. al.: Whole-brain CT perfusion measurement of perfused cerebral blood volume in acute ischemic stroke: probability curve for regional infarction. Radiology 2003; 227: pp. 725-730.
25. Ezzeddine M.A., Lev M.H., McDonald C.T., et. al.: CT angiography with whole brain perfused blood volume imaging: added clinical value in the assessment of acute stroke. Stroke 2002; 33: pp. 959-966.
26. Murayama K., Katada K., Nakane M., et. al.: Whole-brain perfusion CT performed with a prototype 256-detector row CT system: initial experience. Radiology 2009; 250: pp. 202-211.
27. Klingebiel R., Siebert E., Diekmann S., et. al.: 4-D Imaging in cerebrovascular disorders by using 320-slice CT: feasibility and preliminary clinical experience. Acad Radiol 2009; 16: pp. 123-129.
28. Salomon E.J., Barfett J., Willems P.W., et. al.: Dynamic CT angiography and CT perfusion employing a 320-detector row CT: protocol and current clinical applications. Klin Neuroradiol 2009; 19: pp. 187-196.