
Rationale and Objectives
This study aimed to develop whole-lesion apparent diffusion coefficient (ADC)-based entropy-related parameters of cervical cancer to preliminarily assess intratumoral heterogeneity of this lesion in comparison to adjacent normal cervical tissues.
Materials and Methods
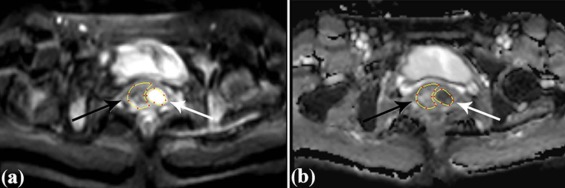
A total of 51 women (mean age, 49 years) with cervical cancers confirmed by biopsy underwent 3-T pelvic diffusion-weighted magnetic resonance imaging with b values of 0 and 800 s/mm 2 prospectively. ADC-based entropy-related parameters including first-order entropy and second-order entropies were derived from the whole tumor volume as well as adjacent normal cervical tissues. Intraclass correlation coefficient, Wilcoxon test with Bonferroni correction, Kruskal-Wallis test, and receiver operating characteristic curve were used for statistical analysis.
Results
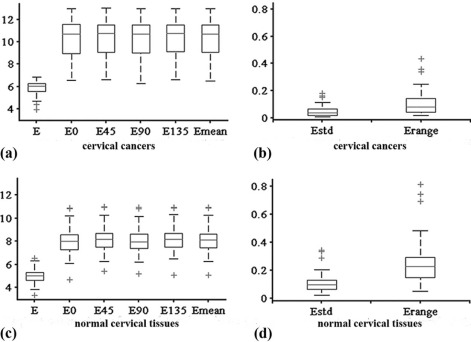
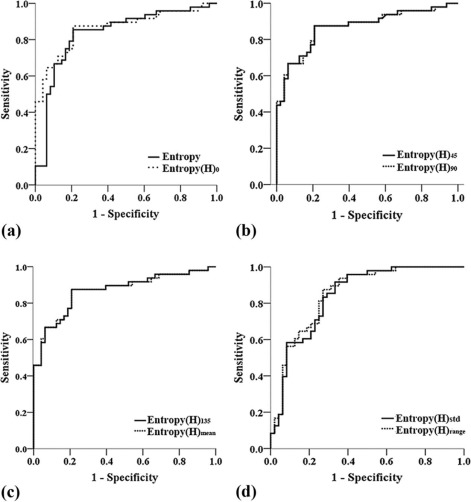
All the parameters showed excellent interobserver agreement (all intraclass correlation coefficients > 0.900). Entropy, entropy(H) 0 , entropy(H) 45 , entropy(H) 90 , entropy(H) 135 , and entropy(H) mean were significantly higher, whereas entropy(H) range and entropy(H) std were significantly lower in cervical cancers compared to adjacent normal cervical tissues (all P <.0001). Kruskal-Wallis test showed that there were no significant differences among the values of various second-order entropies including entropy(H) 0, entropy(H) 45 , entropy(H) 90 , entropy(H) 135 , and entropy(H) mean. All second-order entropies had larger area under the receiver operating characteristic curve than first-order entropy in differentiating cervical cancers from adjacent normal cervical tissues. Further, entropy(H) 45 , entropy(H) 90 , entropy(H) 135 , and entropy(H) mean had the same largest area under the receiver operating characteristic curve of 0.867.
Conclusion
Whole-lesion ADC-based entropy-related parameters of cervical cancers were developed successfully, which showed initial potential in characterizing intratumoral heterogeneity in comparison to adjacent normal cervical tissues.
Introduction
According to the World Cancer Report 2014 of the World Health Organization (WHO), uterine cervical cancer is the fourth most common cancer and the fourth leading cause of cancer mortality in women across the globe. Cervical cancer exhibits various kinds of heterogeneity on both genetic and histopathologic levels such as gene expression, metabolism, angiogenesis, proliferative potential, and cellular morphology . Previous studies have shown that cervical cancers with high intratumoral heterogeneity may have poorer prognosis . Thus, assessing tumor heterogeneity accurately before therapy is of utmost importance for dedicated evaluation, treatment planning, and prognosis prediction in patients with cervical cancers. However, the goal of accurate assessment of tumor heterogeneity through routine clinical procedure such as biopsy cannot be achieved because the procedure only reflects features within a small sample of the entire tumor. Fortunately, multiple image modalities, such as magnetic resonance (MR) imaging and positron emission tomography/computed tomography (PET/CT), have been widely used clinically for preoperative staging or follow-up, which hold great potential to assess the heterogeneity of the tumor as a whole from very different and important perspectives. For example, PET reflected the heterogeneity in terms of metabolism and dynamic contrast-enhanced MR imaging investigated it in terms of angiogenic processes .
Diffusion-weighted (DW) MR imaging (DWI) has been used more and more widely with versatile applications in various diseases, especially in female pelvic tumors including cervical cancer . DWI could reflect the motion of water molecules constrained by tissue ultrastructures noninvasively in a quantitative term of apparent diffusion coefficient (ADC) value, which underwent great change during carcinogenesis . DWI therefore has the potential to assess tumor heterogeneity of cervical cancers from a certain perspective of cellular morphology and tissue ultrastructures.
Get Radiology Tree app to read full this article<
Get Radiology Tree app to read full this article<
Get Radiology Tree app to read full this article<
Get Radiology Tree app to read full this article<
Materials and Methods
Study Population
Get Radiology Tree app to read full this article<
Get Radiology Tree app to read full this article<
MR Examination
Get Radiology Tree app to read full this article<
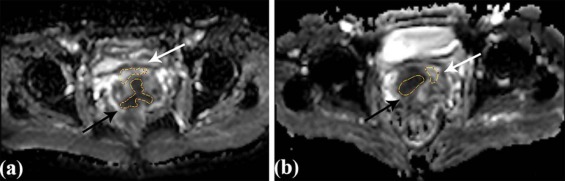
Volume of Interest (VOI) Obtaining
Get Radiology Tree app to read full this article<
Get Radiology Tree app to read full this article<
Get Radiology Tree app to read full this article<
Get Radiology Tree app to read full this article<
Parameter Acquisition
Get Radiology Tree app to read full this article<
Get Radiology Tree app to read full this article<
entropy=−∑G−1i=0pilog(pi) entropy
=
−
∑
i
=
0
G
−
1
p
i
log
(
p
i
)
where G is the number of gray levels within the VOI. p i represents the probability of gray level i across the VOI and is computed by dividing the number of the gray level i by the total pixel number within the VOI. First-order entropy is a statistical measure of variation of gray levels so that it equals to 0 when all values are the same within the VOI and increases as data present larger variation.
Get Radiology Tree app to read full this article<
Get Radiology Tree app to read full this article<
Get Radiology Tree app to read full this article<
Get Radiology Tree app to read full this article<
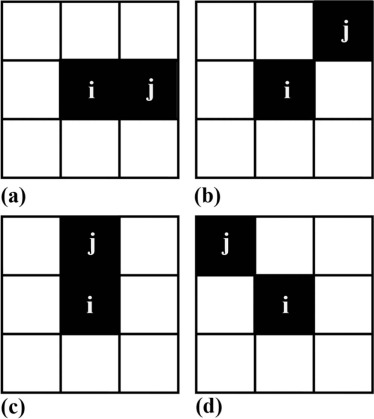
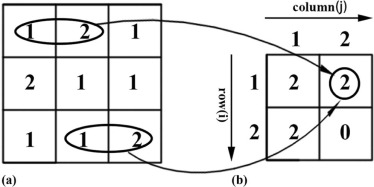
entropy(H)=−∑G−1i=0∑G−1j=0p(i,j)log(p(i,j)) entropy
(
H
)
=
−
∑
i
=
0
G
−
1
∑
j
=
0
G
−
1
p
(
i
,
j
)
log
(
p
(
i
,
j
)
)
where p(i,j) p
(
i
,
j
) is computed by dividing the GLCM element in row i column j by the sum of all GLCM element. In addition, we calculated the average value, the gap between the maximum and minimum value, and the standard deviation of the entropy(H) 0 , entropy(H) 45 , entropy(H) 90 , and entropy(H) 135 , namely, entropy(H) mean , entropy(H) range , and entropy(H) std.
Get Radiology Tree app to read full this article<
Get Radiology Tree app to read full this article<
Statistical Analysis
Get Radiology Tree app to read full this article<
Results
Get Radiology Tree app to read full this article<
Table 1
Inter- and Intra-Observer Agreement for Measurements of Whole-Lesion Entropy-Based Parameters of Apparent Diffusion Coefficient (ADC) Values in Benign and Malignant Cervical Tissue
Parameters Malignant Cervical Tissue Benign Cervical Tissue ICC (inter) ICC (intra) ICC (inter) ICC (intra) Entropy 0.962 (0.950–0.972) 0.995 (0.990–0.997) 0.955 (0.943–0.966) 0.964 (0.937–0.980) Entropy(H) 0 0.975 (0.974–0.992) 0.985 (0.974–0.992) 0.966 (0.958–0.975) 0.950 (0.913–0.972) Entropy(H) 45 0.982 (0.972–0.991) 0.984 (0.972–0.991) 0.970 (0.961–0.982) 0.950 (0.913–0.972) Entropy(H) 90 0.980 (0.973–0.991) 0.985 (0.973–0.991) 0.972 (0.961–0.983) 0.949 (0.911–0.971) Entropy(H) 135 0.978 (0.972–0.991) 0.984 (0.972–0.991) 0.965 (0.953–0.976) 0.950 (0.912–0.972) Entropy(H) mean 0.986 (0.972–0.991) 0.984 (0.972–0.991) 0.983 (0.971–0.992) 0.950 (0.913–0.972) Entropy(H) range 0.971 (0.941–0.981) 0.967 (0.941–0.981) 0.960 (0.949–0.971) 0.946 (0.904–0.970) Entropy(H) std 0.968 (0.951–0.984) 0.972 (0.951–0.984) 0.962 (0.950–0.973) 0.935 (0.884–0.963)
ICC, intraclass correlation coefficient; intra, intraobserver agreement; inter, inter-observer agreement.
Numbers inside parentheses are 95% confidence interval.
ICC value: >0.81, excellent agreement; 0.61–0.80, good agreement; 0.41–0.60, fair agreement; <0.40, poor agreement.
Table 2
Whole-Lesion Entropy-Based Parameters of Apparent Diffusion Coefficient (ADC) Values in Benign and Malignant Cervical Tissue
Parameters_n_ Malignant Cervical Tissue Benign Cervical Tissue_P_ value \* Entropy 51 6.04 (5.54, 6.24) 5.02 (4.62, 5.33) <.0001 Entropy(H) 0 51 10.73 (8.95, 11.61) 8.02 (7.27, 8.60) <.0001 Entropy(H) 45 51 10.74 (9.10, 11.61) 8.16 (7.45, 8.71) <.0001 Entropy(H) 90 51 11.71 (9.00, 11.60) 7.97 (7.38, 8.63) <.0001 Entropy(H) 135 51 10.75 (9.10, 11.62) 8.16 (7.48, 8.70) <.0001 Entropy(H) mean 51 10.73 (9.04, 11.62) 8.12 (7.41, 8.65) <.0001 Entropy(H) range 51 0.08 (0.04, 0.15) 0.22 (0.14, 0.29) <.0001 Entropy(H) std 51 0.04 (0.02, 0.07) 0.10 (0.06, 0.13) <.0001
Data are given as median values. Numbers in parentheses are interquartile ranges.
Get Radiology Tree app to read full this article<
Get Radiology Tree app to read full this article<
Get Radiology Tree app to read full this article<
Table 3
Receiver Operating Characteristic Results of Whole-Lesion Entropy-Based Parameters of Apparent Diffusion Coefficient (ADC) Values for Distinguishing Benign and Malignant Cervical Tissues
Parameters AUC Sensitivity (%) Specificity (%) Cutoff Value_P_ value Entropy 0.833 85.4 79.2 5.40 <.0001 Entropy(H) 0 0.864 87.5 79.2 8.73 <.0001 Entropy(H) 45 0.867 87.5 79.2 8.81 <.0001 Entropy(H) 90 0.867 87.5 79.2 8.76 <.0001 Entropy(H) 135 0.867 87.5 79.2 8.84 <.0001 Entropy(H) mean 0.867 87.5 79.2 8.78 <.0001 Entropy(H) range 0.850 87.5 72.9 0.12 <.0001 Entropy(H) std 0.841 91.7 66.7 0.05 <.0001
AUC, area under the receiver operating characteristic curve.
Get Radiology Tree app to read full this article<
Discussion
Get Radiology Tree app to read full this article<
Get Radiology Tree app to read full this article<
Get Radiology Tree app to read full this article<
Get Radiology Tree app to read full this article<
Get Radiology Tree app to read full this article<
Get Radiology Tree app to read full this article<
Get Radiology Tree app to read full this article<
Get Radiology Tree app to read full this article<
Get Radiology Tree app to read full this article<
Get Radiology Tree app to read full this article<
Acknowledgments
Get Radiology Tree app to read full this article<
References
1. Just N.: Improving tumour heterogeneity MRI assessment with histograms. Br J Cancer 2014; 111: pp. 2205-2213.
2. O’Connor J.P.B., Rose C.J., Waterton J.C., et. al.: Imaging intratumor heterogeneity: role in therapy response, resistance, and clinical outcome. Clin Cancer Res 2014; 21: pp. 249-257.
3. Bachtiary B., Boutros P., Pintilie M., et. al.: Gene expression profiling in cervical cancer: an exploration of intratumor heterogeneity. Clin Cancer Res 2006; 12: pp. S91.
4. Davidson S.E., West C.M.L., Roberts S.A., et. al.: Radiosensitivity testing of primary cervical carcinoma: evaluation of intra- and inter-tumour heterogeneity. Radiother Oncol 1990; 18: pp. 349-356.
5. Davnall F., Yip C.S.P., Ljungqvist G., et. al.: Assessment of tumor heterogeneity: an emerging imaging tool for clinical practice?. Insights Imaging 2012; 3: pp. 573-589.
6. Höckel M., Schlenger K., Aral B., et. al.: Association between tumor hypoxia and malignant progression in advanced cancer of the uterine cervix. Cancer Res 1996; 56: pp. 4509-4515.
7. Peng S.L., Chen C.F., Liu H.L., et. al.: Analysis of parametric histogram from dynamic contrast-enhanced MRI: application in evaluating brain tumor response to radiotherapy. NMR Biomed 2013; 26: pp. 443-450.
8. Huang W., Liu B., Fan M., et. al.: The early predictive value of a decrease of metabolic tumor volume in repeated 18 F-FDG PET/CT for recurrence of locally advanced non-small cell lung cancer with concurrent radiochemotherapy. Eur J Radiol 2015; 84: pp. 482-488.
9. Verma S., Rajesh A., Morales H., et. al.: Assessment of aggressiveness of prostate cancer: correlation of apparent diffusion coefficient with histologic grade after radical prostatectomy. AJR Am J Roentgenolo 2011; 196: pp. 374-381.
10. Kobayashi S., Koga F., Kajino K., et. al.: Apparent diffusion coefficient value reflects invasive and proliferative potential of bladder cancer. J Magn Reson Imaging 2014; 39: pp. 172-178.
11. Akashi M., Nakahusa Y., Yakabe T., et. al.: Assessment of aggressiveness of rectal cancer using 3-T MRI: correlation between the apparent diffusion coefficient as a potential imaging biomarker and histologic prognostic factors. Acta Radiol 2014; 55: pp. 524-531.
12. Bae H., Yoshida S., Matsuoka Y., et. al.: Apparent diffusion coefficient value as a biomarker reflecting morphological and biological features of prostate cancer. Int Urol Nephrol 2014; 46: pp. 555-561.
13. Le Bihan D.: Apparent diffusion coefficient and beyond: what diffusion MR imaging can tell us about tissue structure. Radiology 2013; 268: pp. 318-322.
14. Guan Y., Shi H., Chen Y., et. al.: Whole-lesion histogram analysis of apparent diffusion coefficient for the assessment of cervical cancer. J Comput Assist Tomogr 2016; 40: pp. 212-217.
15. Downey K., Riches S.F., Morgan V.A., et. al.: Relationship between imaging biomarkers of stage I cervical cancer and poor-prognosis histologic features: quantitative histogram analysis of diffusion-weighted MR images. AJR Am J Roentgenolo 2013; 200: pp. 314-320.
16. Lin Y., Li H., Chen Z., et. al.: Correlation of histogram analysis of apparent diffusion coefficient with uterine cervical pathologic finding. AJR Am J Roentgenolo 2015; 204: pp. 1125-1131.
17. Ryu Y.J., Choi S.H., Park S.J., et. al.: Glioma: application of whole-tumor texture analysis of diffusion-weighted imaging for the evaluation of tumor heterogeneity. PLoS ONE 2014; 9: pp. e108335.
18. Cao M.-Q., Suo S.-T., Zhang X.-B., et. al.: Entropy of T2-weighted imaging combined with apparent diffusion coefficient in prediction of uterine leiomyoma volume response after uterine artery embolization. Acad Radiol 2014; 21: pp. 437-444.
19. Castellano G., Bonilha L., Li L.M., et. al.: Texture analysis of medical images. Clin Radiol 2004; 59: pp. 1061-1069.
20. Naqa I.E., Grigsby P.W., Apte A., et. al.: Exploring feature-based approaches in PET images for predicting cancer treatment outcomes. Pattern Recognit 2009; 42: pp. 1162-1171.
21. Yang F., Thomas M.A., Dehdashti F., et. al.: Temporal analysis of intratumoral metabolic heterogeneity characterized by textural features in cervical cancer. Eur J Nucl Med Mol Imaging 2013; 40: pp. 716-727.
22. Haralick R.M., Shanmugam K., Dinstein I.H.: Textural features for image classification. IEEE Trans Syst Man Cybern 1973; smc-3: pp. 610-621.
23. Wibmer A., Hricak H., Gondo T., et. al.: Haralick texture analysis of prostate MRI: utility for differentiating non-cancerous prostate from prostate cancer and differentiating prostate cancers with different Gleason scores. Eur Radiol 2015; 25: pp. 2840-2850.
24. Barry B., Buch K., Soto J.A., et. al.: Quantifying liver fibrosis through the application of texture analysis to diffusion weighted imaging. Magn Reson Imaging 2014; 32: pp. 84-90.
25. Viswanath S.E., Bloch N.B., Chappelow J.C., et. al.: Central gland and peripheral zone prostate tumors have significantly different quantitative imaging signatures on 3 tesla endorectal, in vivo T2-weighted MR imagery. J Magn Reson Imaging 2012; 36: pp. 213-224.
26. Niaf E., Rouvière O., Mège-Lechevallier F., et. al.: Computer-aided diagnosis of prostate cancer in the peripheral zone using multiparametric MRI. Phys Med Biol 2012; 57: pp. 3833-3851.
27. Haralick R.M., Shanmugam K., Dinstein I.H., Haralick R.M., Shanmuga K., Dinstein I.: Textural features for image classification. IEEE Trans Syst Man Cybern 1973; SMC3: pp. 610-621.
28. Georgiadis P., Cavouras D., Kalatzis I., et. al.: Enhancing the discrimination accuracy between metastases, gliomas and meningiomas on brain MRI by volumetric textural features and ensemble pattern recognition methods. Magn Reson Imaging 2009; 27: pp. 120-130.
29. Suo S., Zhang K., Cao M., et. al.: Characterization of breast masses as benign or malignant at 3.0T MRI with whole-lesion histogram analysis of the apparent diffusion coefficient. J Magn Reson Imaging 2016; 43: pp. 894-902.
30. Kierans A.S., Bennett G.L., Mussi T.C., et. al.: Characterization of malignancy of adnexal lesions using ADC entropy: comparison with mean ADC and qualitative DWI assessment. J Magn Reson Imaging 2013; 37: pp. 164-171.
31. Padhani A.R., Liu G., Mu-Koh D., et. al.: Diffusion-weighted magnetic resonance imaging as a cancer biomarker: consensus and recommendations. Neoplasia 2009; 11: pp. 102-125.
32. Ryu Y.J., Choi S.H., Park S.J., et. al.: Glioma: application of whole-tumor texture analysis of diffusion-weighted imaging for the evaluation of tumor heterogeneity. PLoS ONE 2014; 9: pp. e108335.
33. Rose C.J., Mills S.J., O’Connor J.P.B., et. al.: Quantifying spatial heterogeneity in dynamic contrast-enhanced MRI parameter maps. Magn Reson Med 2009; 62: pp. 488-499.
34. Chen K., Hu L.S., Ning S., et. al.: Multi-parametric MRI and texture analysis to visualize spatial histologic heterogeneity and tumor extent in glioblastoma. PLoS ONE 2015; 10: e0141506
35. Kierans A.S., Rusinek H., Lee A., et. al.: Textural differences in apparent diffusion coefficient between low- and high-stage clear cell renal cell carcinoma. AJR Am J Roentgenolo 2014; 203: pp. W637-W644.
36. Aerts H.J.W.L., Velazquez E.R., Leijenaar R.T.H., et. al.: Corrigendum: decoding tumour phenotype by noninvasive imaging using a quantitative radiomics approach. Nat Commun 2014; 5: pp. 4006.
37. Rosenkrantz A.B., Triolo M.J., Melamed J., et. al.: Whole-lesion apparent diffusion coefficient metrics as a marker of percentage Gleason 4 component within Gleason 7 prostate cancer at radical prostatectomy. J Magn Reson Imaging 2015; 41: pp. 708-714.