
Rationale and Objectives
Workflow efficiency and workload of radiological technologists (RTs) were compared in head examinations performed with two 1.5 T magnetic resonance (MR) scanners equipped with or without an automated user interface called “day optimizing throughput” (Dot) workflow engine.
Materials and Methods
Thirty-four patients with known intracranial pathology were examined with a 1.5 T MR scanner with Dot workflow engine (Siemens MAGNETOM Aera) and with a 1.5 T MR scanner with conventional user interface (Siemens MAGNETOM Avanto) using four standardized examination protocols. The elapsed time for all necessary work steps, which were performed by 11 RTs within the total examination time, was compared for each examination at both MR scanners. The RTs evaluated the user-friendliness of both scanners by a questionnaire. Normality of distribution was checked for all continuous variables by use of the Shapiro-Wilk test. Normally distributed variables were analyzed by Student’s paired t -test, otherwise Wilcoxon signed-rank test was used to compare means.
Results
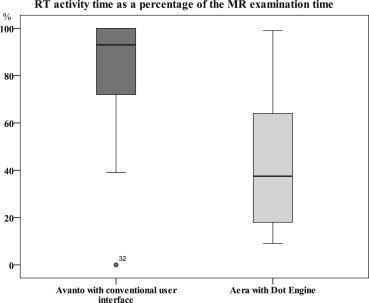
Total examination time of MR examinations performed with Dot engine was reduced from 24:53 to 20:01 minutes ( P < .001) and the necessary RT intervention decreased by 61% ( P < .001). The Dot engine’s automated choice of MR protocols was significantly better assessed by the RTs than the conventional user interface ( P = .001).
Conclusions
According to this preliminary study, the Dot workflow engine is a time-saving user assistance software, which decreases the RTs’ effort significantly and may help to automate neuroradiological examinations for a higher workflow efficiency.
In the past, complete digitalization of radiology departments using a combination of a radiology information system (RIS) and picture archiving and communication system (PACS) has been shown to be time-saving at nearly all steps of the workflow . To further optimize productivity of magnetic resonance imaging (MRI) units within departments of diagnostic radiology, increasing attention is being placed on workflow automation. Workflow is the process of analyzing the individual steps that occur during performance of MRI exams . The actual scan time of 1.5 Tesla (T) MRI scanners cannot significantly be decreased without a reduction of image quality. However, the automation of magnetic resonance (MR) examinations by simplified user interfaces may be the key to increase time efficiency of MRI units, for instance by reducing dead time between individual scanning steps.
“Day optimizing throughput” (Dot) workflow engines are automated user interfaces of the new 1.5 T and 3 T MRI scanners by Siemens Healthcare, Erlangen, Germany (eg, MAGNETOM Aera). This user assistance software offers a customizable framework for automated MR examinations of different body regions (eg, brain, abdomen, heart, vessels). This study deals with the brain Dot engine that should simplify the workflow of standardized head examinations by the integration of patient information, step-by-step user guidance, and a choice of predefined exam strategies ( Fig 1 ) in comparison to commonly used MR software ( Fig 2 ). All Dot engines offer three overviews named “parameter view,” which displays commonly used MR protocol parameters for adjustment; “patient view,” which provides exam-relevant patient information; and “guidance view,” which offers image examples and reference texts for user guidance ( Fig 3 ). Patient data and positioning information are provided at the scanner for fast patient setup, and if necessary voice commands are integrated into the scan process to ensure synchronization of breathholds and scanning.
 Open full size image
Figure 1
The Dot workflow engine of MAGNETOM Aera offers semiautomated bolus timing for contrast-enhanced magnetic resonance angiography (MRA). After acquisition of test bolus images, the radiological technologist has to mark one carotid artery (a) and one jugular vein manually. In addition, the preselected field of view has to be confirmed with a mouse click (not shown). The optimal delay for the injection of contrast media is calculated with help of the arterial and venous bolus curves. The delay time is integrated automatically in the simplified parameter card (b) . Contrast injection and acquisition of MRA images are completed automatically.
 Open full size image
Figure 2
(a) The conventional user interface of MAGNETOM Avanto requires more work steps to acquire a contrast-enhanced magnetic resonance angiography (MRA). Field of view, alignment, and number of slices have to be selected manually in the vessel scout images or in the parameter card, respectively. The carotid artery has to be marked to calculate the delay time with a separate software tool named “mean curve” (b) . Baseline and bolus peak of the bolus curve have to be selected and confirmed by several mouse clicks. The resulting delay time has to be filled in the parameter card manually. With further mouse clicks, contrast injection and acquisition of MRA images are started.
 Open full size image
Figure 3
Guidance view is a software tool integrated in Dot engines, which optionally guides users with sample images and texts through the magnetic resonance (MR) examination. In this example, work steps are explained to acquire the test bolus for contrast-enhanced MR angiographies.
Get Radiology Tree app to read full this article<
Get Radiology Tree app to read full this article<
Get Radiology Tree app to read full this article<
Get Radiology Tree app to read full this article<
Get Radiology Tree app to read full this article<
Materials and methods
Study Design and Patients
Get Radiology Tree app to read full this article<
MR Scanners and Sequences
Get Radiology Tree app to read full this article<
Table 1
Technical Data of Both 1.5 T MR Scanners
MAGNETOM 1.5 T Aera Avanto Length 145 cm 160 cm Bore diameter 70 cm 60 cm Software VD11D VB17 Maximum gradient field (x/y/z) 45/45/45 mT/m 40/40/45 mT/m Gradient slew rate 200 T/m/s 200 T/ms Field of view 50 × 50 × 45 cm 50 cm Head coils 20 channels 20 channels Dot workflow engines Yes No
Get Radiology Tree app to read full this article<
Get Radiology Tree app to read full this article<
Table 2
MR Protocols and Sequence Parameters
MR Scanner Avanto Aera Avanto Aera Avanto Aera Avanto Aera Avanto Aera Tumor FLAIR FLAIR T1 T1 SWI SWI MPRAGE CE MPRAGE CE DWI DWI TR (ms) 9000 9000 375 425 48 49 1980 1920 3100 4000 TE (ms) 109 105 9.1 9.1 40 40 3.09 3.15 84 84 Flip (°), EPI factor 150 150 90 90 15 15 10 10 128 128 Voxel size (mm) 0.9 × 0.9 × 6 0.4 × 0.4 × 6 1.1 × 0.9 × 6 0.4 × 0.4 × 6 1.2 × 0.7 × 2 0.7 × 0.7 × 2 1.1 × 0.5 × 1 0.5 × 0.5 × 1 1.8 × 1.8 × 5 1.8 × 1.8 × 5 TA (minutes:seconds) 03:20 03:38 02:09 03:02 03:18 05:39 05:00 04:55 01:13 01:34 PAT factor 0 0 0 0 2 2 2 2 2 2 Metastasis FLAIR FLAIR T1 T1 SWI SWI MPRAGE CE MPRAGE CE T1 CE tumor T1 CE tumor TR (ms) 9000 9000 375 425 48 49 1980 1920 580 500 TE (ms) 109 105 9.1 9.1 40 40 3.09 3.15 17 12 Flip (°), EPI factor 150 150 90 90 15 15 10 10 90 90 Voxel size (mm) 0.9 × 0.9 × 6 0.4 × 0.4 × 6 1.1 × 0.9 × 6 0.4 × 0.4 × 6 1.2 × 0.7 × 2 0.7 × 0.7 × 2 1.1 × 0.5 × 1 0.5 × 0.5 × 1 1.3 × 0.9 × 6 0.7 × 0.7 × 6 TA (minutes:seconds) 03:20 03:38 02:09 03:02 03:18 05:39 05:00 04:55 02:53 03:32 PAT factor 0 0 0 0 2 2 2 2 0 0 Pituitary gland T2 T2 T1 sag T1 sag T1 cor T1 cor T1 sag CE T1 sag CE T1 cor CE T1 cor CE TR (ms) 3780 4860 458 500 412 500 459 570 413 562 TE (ms) 108 101 12 15 12 15 12 15 12 15 Flip (°), EPI factor 150 150 180 90 180 90 180 90 180 90 Voxel size (mm) 0.9 × 0.9 × 6 0.3 × 0.3 × 6 1.1 × 0.9 × 2 0.9 × 0.9 × 2 1.0 × 0.8 × 2 0.4 × 0.4 × 2 0.9 × 0.4 × 2 0.4 × 0.4 × 2 0.8 × 0.4 × 2 0.4 × 0.4 × 2 TA (minutes:seconds) 01:28 01:24 02:09 02:23 01:45 01:58 02:40 04:05 03:16 04:01 PAT factor 2 0 0 2 0 2 0 0 0 0 Aneurysm T2 T2 T1 T1 TOF TOF DWI DWI 3D MRA 3D MRA TR (ms) 3970 5340 380 570 26 24 2500 4000 3.38 3.03 TE (ms) 106 105 8.6 15 7 7 84 85 1.19 1.11 Flip (°), EPI factor 180 150 90 90 25 25 128 128 30 25 Voxel size (mm) 0.9 × 0.4 × 6 0.4 × 0.4 × 6 0.8 × 0.4 × 2 0.4 × 0.4 × 2 0.7 × 0.7 × 0.7 0.4 × 0.4 × 0.5 1.8 × 1.8 × 5 1.8 × 1.8 × 5 1.2 × 0.6 × 0.8 1 × 1 × 1 TA (minutes:seconds) 02:03 01:11 04:19 04:04 04:05 05:16 00:59 01:34 00:23 00:20 PAT factor 0 2 0 0 2 2 2 2 2 2
CE, contrast-enhanced; cor, coronal; DWI, diffusion-weighted imaging; EPI, echo planar imaging; FLAIR, fluid-attenuated inversion recovery; Flip, flip angle; MPRAGE, magnetization prepared rapid gradient echo; PAT, parallel acquisition technique; sag, sagittal; SWI, susceptibility-weighted imaging; TA, acquisition time; TE, echo time; TOF, time of flight MR angiography; TR, time of repetition.
Get Radiology Tree app to read full this article<
Assessment of Usability and Workflow Efficiency
Get Radiology Tree app to read full this article<
Get Radiology Tree app to read full this article<
Statistical Methods
Get Radiology Tree app to read full this article<
Get Radiology Tree app to read full this article<
Results
Get Radiology Tree app to read full this article<
Get Radiology Tree app to read full this article<
Table 3
Radiological Technologist Assessment of Operability of Two 1.5 T MR Scanners on a 10-point Scale
Parameters MR Scanner 1 2 3 4 5 6 7 8 9 10 n_P_ Value Patient positioning Avanto 0 0 0 0 0 1 3 7 7 15 33 .011 † Aera 0 0 0 0 0 0 1 13 15 4 33 Operability during the MR exam Avanto 0 0 0 0 0 0 0 10 11 12 33 .002 † Aera 0 0 1 0 1 2 11 5 9 4 33 Adaptation of sequences Avanto 0 0 0 0 0 0 1 9 10 13 33 .002 † Aera 0 0 1 0 0 0 8 12 11 1 33 Necessary interaction Avanto 0 0 0 1 1 4 8 5 11 3 33 .380 Aera 0 0 0 1 0 1 4 9 16 2 33 Choice of protocols and adjustment Avanto 0 0 0 0 0 2 3 8 15 3 31 .001 ∗ Aera 0 0 0 0 0 0 0 1 12 18 31 User interface versus guidance and protocol view Avanto 0 0 1 0 0 3 1 6 9 7 27 .193 Aera 0 0 3 0 2 1 1 1 12 4 24
MR, magnetic resonance; n, number of patients with assessment.
P < .05 was regarded as statistically significant.
Get Radiology Tree app to read full this article<
Get Radiology Tree app to read full this article<
Get Radiology Tree app to read full this article<
Get Radiology Tree app to read full this article<
Get Radiology Tree app to read full this article<
Get Radiology Tree app to read full this article<
Table 4
Differences of Exam Time and RT Activity Time during Head Exams Performed without Dot Engine (Avanto) or with Dot Engine (Aera)
Patient No. Protocol Avanto Exam Time (min:sec) Aera Exam Time (min:sec) Avanto RT Activity (min:sec) Aera RT Activity (min:sec) Avanto RT Activity (%) Aera RT Activity (%) Exam Time Delta (min:sec) Exam Acceleration (%) RT Activity Delta (min:sec) RT Activity Reduction (%) 1 Pituitary gland 20:25 16:38 17:30 06:15 86 38 03:47 19 11:15 64 2 Pituitary gland 22:36 17:47 19:37 04:48 87 27 04:49 21 14:49 76 3 Pituitary gland 33:35 19:17 33:35 09:17 100 48 14:18 43 24:18 72 4 Pituitary gland 23:48 17:18 22:56 06:22 96 37 06:30 27 16:34 72 5 Pituitary gland 21:08 16:22 15:00 05:26 71 33 04:46 23 09:34 64 6 Pituitary gland 26:26 26:27 26:26 16:28 100 62 00:01 0 09:58 38 7 Pituitary gland 31:12 25:33 21:23 04:58 69 19 05:39 18 16:25 77 8 Pituitary gland 22:55 19:29 13:04 03:45 57 19 03:26 15 09:19 71 9 Pituitary gland 24:15 13:57 19:04 01:28 79 11 10:18 42 17:36 92 10 Pituitary gland 27:50 25:34 25:48 11:34 93 45 02:16 8 14:13 55 11 Pituitary gland 24:20 24:18 21:29 03:29 88 14 00:02 0 18:00 84 12 Pituitary gland 31:33 24:41 31:24 02:07 100 9 06:52 22 29:17 93 13 Pituitary gland 21:17 16:04 11:54 02:04 56 13 05:13 25 09:50 83 14 Pituitary gland 29:31 25:01 27:24 02:27 93 10 04:30 15 24:57 91 15 Metastasis 23:18 23:32 21:35 14:57 93 64 00:14 −1 06:37 31 16 Metastasis 25:16 17:25 25:07 05:13 99 30 07:51 31 19:54 79 17 Metastasis 22:49 15:07 19:56 10:47 87 71 07:42 34 09:09 46 18 Metastasis 25:36 16:49 25:31 08:53 100 53 08:47 34 16:38 65 19 Metastasis 20:53 17:04 20:44 03:04 99 18 03:49 18 17:40 85 20 Metastasis 26:24 22:40 14:28 18:19 55 81 03:54 18 03:51 19 21 Tumor 29:32 25:55 29:32 06:56 100 27 03:37 12 22:36 77 22 Tumor 22:45 16:01 16:20 06:12 72 39 06:44 30 10:08 62 23 Tumor 26:23 18:42 26:23 02:15 100 12 07:41 29 24:08 91 24 Tumor 25:02 23:00 20:55 16:31 84 72 02:02 8 04:24 21 25 Tumor 25:24 14:57 24:25 13:14 96 89 10:27 41 11:11 46 26 Tumor 30:36 24:07 30:27 23:48 100 99 06:29 21 06:39 22 27 Tumor 25:18 14:53 09:45 06:17 39 42 10:25 41 03:28 36 28 Tumor 24:51 20:50 24:42 06:32 99 31 04:01 16 18:10 74 29 Aneurysm 18:30 16:27 18:30 02:09 100 13 02:03 11 16:21 88 30 Aneurysm 26:37 23:11 26:37 02:05 100 9 03:26 13 24:32 92 31 Aneurysm 23:56 22:03 23:54 21:44 100 99 01:53 8 02:10 9 32 Aneurysm 22:08 19:43 14:09 10:53 64 55 02:25 11 03:16 23 33 Aneurysm 23:55 22:54 NA 20:00 NA 87 01:01 4 NA NA 34 Aneurysm 16:04 17:18 14:38 13:13 91 76 01:14 5 01:25 8Mean24 : 5320 : 0121 : 3808 : 37864304 : 571913 : 3561SD03 : 4603 : 5305 : 5706 : 18162803 : 231307 : 3227
Delta, difference in examination time or RT activity (Aera vs. Avanto); exam time, total examination time; NA, not acquired; RT activity, activity time of radiological technicians during total examination time; mean, mean value; SD, standard deviation.
Get Radiology Tree app to read full this article<
Discussion
Get Radiology Tree app to read full this article<
Get Radiology Tree app to read full this article<
Get Radiology Tree app to read full this article<
Get Radiology Tree app to read full this article<
Limitations
Get Radiology Tree app to read full this article<
Get Radiology Tree app to read full this article<
Conclusion
Get Radiology Tree app to read full this article<
Acknowledgments
Get Radiology Tree app to read full this article<
References
1. Langen H.L., Bielmeier J., Wittenberg G., et. al.: [Workflow improvement and efficiency gain with near total digitalization of a radiology department]. Rofo 2003; 175: pp. 1309-1316.
2. Reiner B., Siegel E., Carrino J.A.: Workflow optimization: current trends and future directions. J Digit Imaging 2002; 15: pp. 141-152.
3. Redfern R.O., Langlotz C.P., Abbuhl S.B., et. al.: The effect of PACS on the time required for technologists to produce radiographic images in the emergency department radiology suite. J Digit Imaging 2002; 15: pp. 153-160.
4. Lu X., Jolly M.P., Georgescu B., et. al.: Automatic view planning for cardiac MRI acquisition. Med Image Comput Comput Assist Interv 2011; 14: pp. 479-486.
5. Muller-Horvat C., Plathow C., Ludescher B., et. al.: [Generating statements at whole-body imaging with a workflow-optimized software tool–first experiences with multireader analysis]. Rofo 2007; 179: pp. 721-727.
6. Faggioni L., Neri E., Cerri F., et. al.: Integrating image processing in PACS. Eur J Radiol 2011; 78: pp. 210-224.
7. Shi L., Wang D., Chu W.C., et. al.: Automatic MRI segmentation and morphoanatomy analysis of the vestibular system in adolescent idiopathic scoliosis. Neuroimage 2011; 54: pp. S180-S188.
8. Suinesiaputra A., Frangi A.F., Lamb H.J., et. al.: Automatic prediction of myocardial contractility improvement in stress MRI using shape morphometrics with independent component analysis. Inf Process Med Imaging 2005; 19: pp. 321-332.
9. Verard L., Allain P., Travere J.M., et. al.: Fully automatic identification of AC and PC landmarks on brain MRI using scene analysis. IEEE Trans Med Imaging 1997; 16: pp. 610-616.
10. Zijdenbos A.P., Forghani R., Evans A.C.: Automatic “pipeline” analysis of 3-D MRI data for clinical trials: application to multiple sclerosis. IEEE Trans Med Imaging 2002; 21: pp. 1280-1291.
11. Bhat H., Lai P., Li D.: Self-tracking of contrast kinetics for automatic triggering of contrast-enhanced whole-heart coronary magnetic resonance angiography. J Magn Reson Imaging 2009; 29: pp. 809-816.
12. Partridge S.C., Heumann E.J., Hylton N.M.: Semi-automated analysis for MRI of breast tumors. Stud Health Technol Inform 1999; 62: pp. 259-260.
13. Schaefer A.O., Langer M., Baumann T.: Continuously moving table MRI in oncology. Rofo 2010; 182: pp. 954-964.
14. Hintze C., Stemmer A., Bock M., et. al.: A hybrid breath hold and continued respiration-triggered technique for time-resolved 3D MRI perfusion studies in lung cancer. Rofo 2010; 182: pp. 45-52.
15. Benner T., Wisco J.J., van der Kouwe A.J., et. al.: Comparison of manual and automatic section positioning of brain MR images. Radiology 2006; 239: pp. 246-254.
16. Koken P., Dries S.P., Keupp J., et. al.: Towards automatic patient positioning and scan planning using continuously moving table MR imaging. Magn Reson Med 2009; 62: pp. 1067-1072.
17. Teichgraber U., de Bucourt M.: [Quality management systems in radiology: implementation in hospital and radiology practice]. Rofo 2010; 182: pp. 986-992.